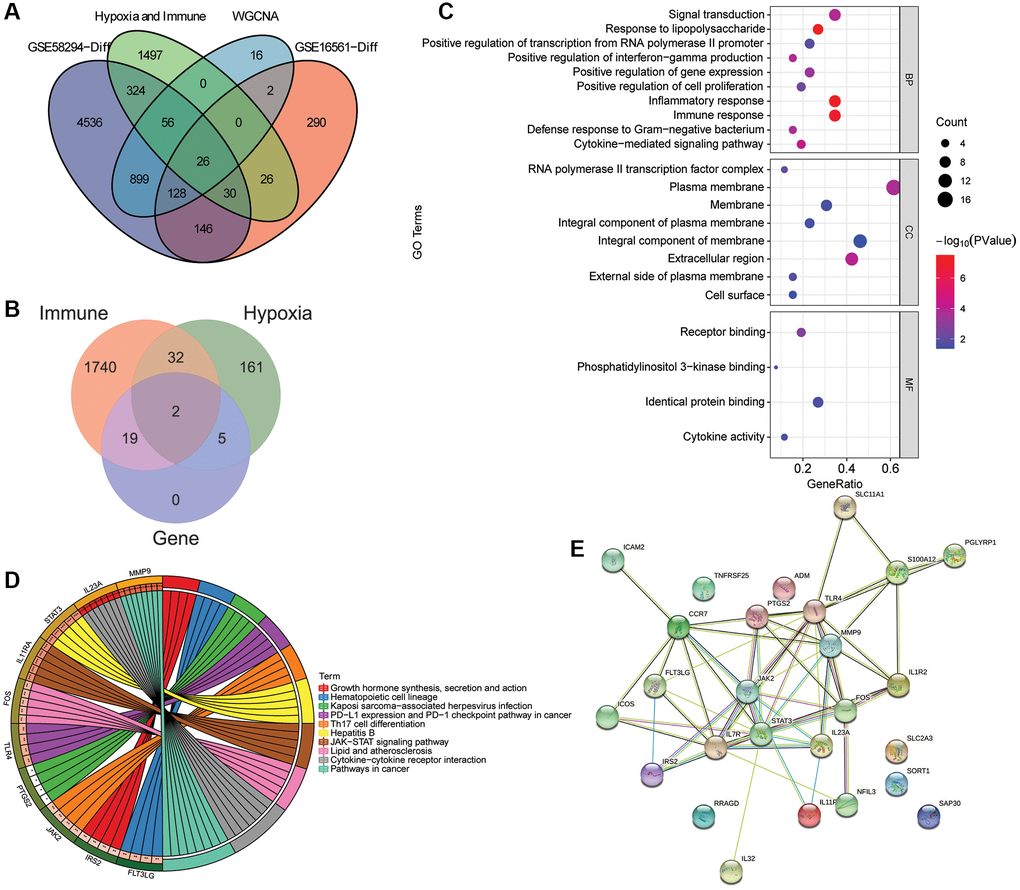
Figure 3.Identification and functional enrichment analysis of intersection mRNAs. (A) Venn diagram of intersection of the DEmRNAs in the GSE58294 dataset, the DEmRNAs in the GSE16561 dataset, the candidate key mRNAs in the WGCNA and the set of IRGs and HRGs; (B) Venn diagram of the intersection mRNAs, IRGs and HRGs; (C) GO functional enrichment analysis of intersection mRNAs; (D) KEGG functional enrichment analysis of intersection mRNAs; (E) A PPI network was constructed based on STRING database to study the regulatory relationship between intersection mRNAs.