Submit an Article
Navigate
Home
Editorial Board
Editorial Policies
Current Volume
Archive
Scientific Integrity
Publication Ethics Statements
Interviews with Outstanding Authors
Newsroom
Sponsored Conferences
Podcast
Contact
Special Collections
Submit an Article
Online ISSN: 1945-4589
Research Paper
|
Volume 15, Issue 24
|
pp. 15134–15160
Experimental validation and pan-cancer analysis identified COL10A1 as a novel oncogene and potential therapeutic target in prostate cancer
Back to article
Figure 3
(3 of 14)
−
100%
+
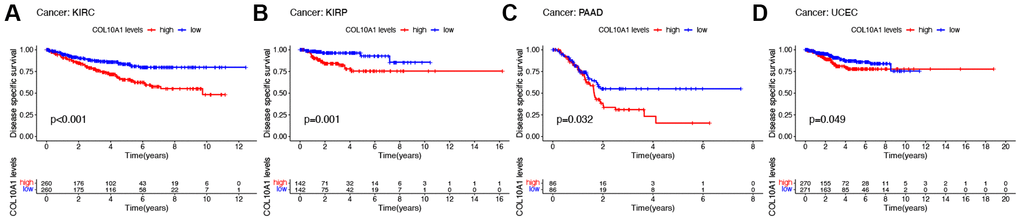
Figure 3.
Kaplan–Meier survival analyses of the prognostic value of COL10A1 expression level for DSS in different cancer types.
DSS according to high and low expression of COL10A1 in KIRC, KIRP, PAAD and UCEC from the TCGA database (
A
–
D
).