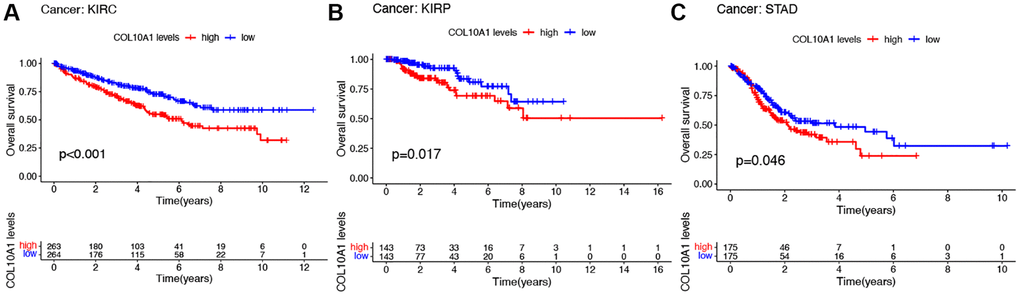
Figure 2.Kaplan–Meier survival analyses of the prognostic value of COL10A1 expression level for OS in different cancer types. OS according to high and low COL10A1 expression in KIRC, KIRP and STAD from TCGA database (A–C).
Figure 2 — Experimental validation and pan-cancer analysis identified COL10A1 as a novel oncogene and potential therapeutic target in prostate cancer | Aging