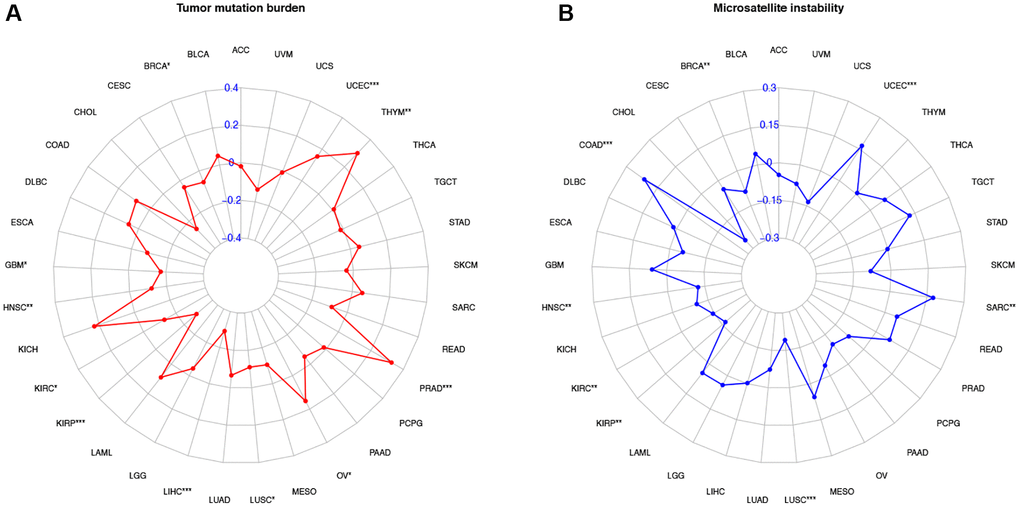
Figure 10.Correlation of COL10A1 expression with tumor mutation burden (TMB) and microsatellite instability (MSI) in multiple cancers. Correlation between TMB and COL10A1 expression (A). Correlation between MSI and COL10A1 expression (B). The Spearman correlation coefficients are shown above the bar graphs. (Spearman Correlation test, p < 0.05 was considered significant, *p < 0.05, **p < 0.01, ***p < 0.001).