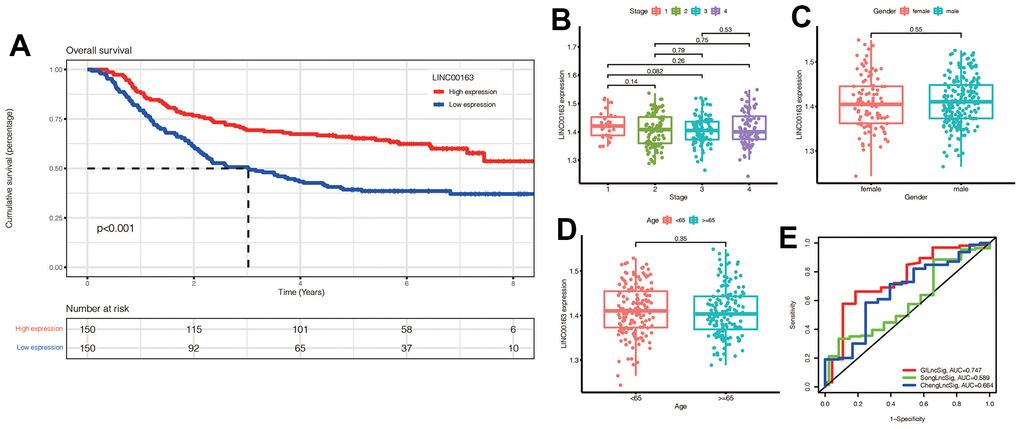
Figure 12.(A) KM survival curve of LINC00163 in gastric cancer:High expression of LINC00163 was associated with poor prognosis (p<0.001). (B–D) Expression of LINC00163 in different stages, genders and ages of gastric cancer. (E) Our model was compared with other models by plotting a 5-year ROC curve associated with prognosis.