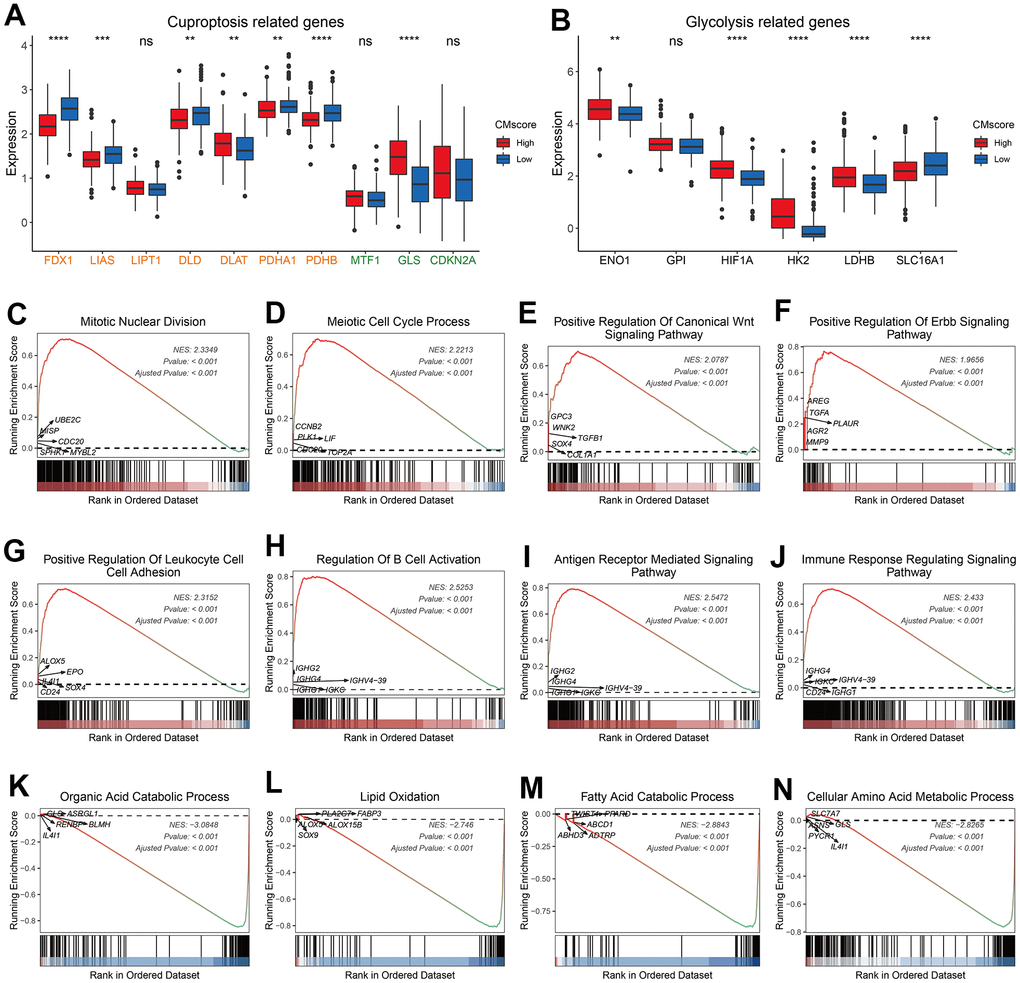
Figure 4.Pathway enrichment analyses of CMscore-based HCC groups. (A, B) The box plot showing the expression of cuproptosis (A) and glycolysis (B) related genes in high- and low-CMscore subgroups of the TCGA_LIHC dataset. (C–N) GSEA of the high- (D) and low-CMscore (E) subgroup in the TCGA-LIHC cohort. P-values were shown as *p < 0.05, **p < 0.01, ***p < 0.001, and ****p < 0.0001.