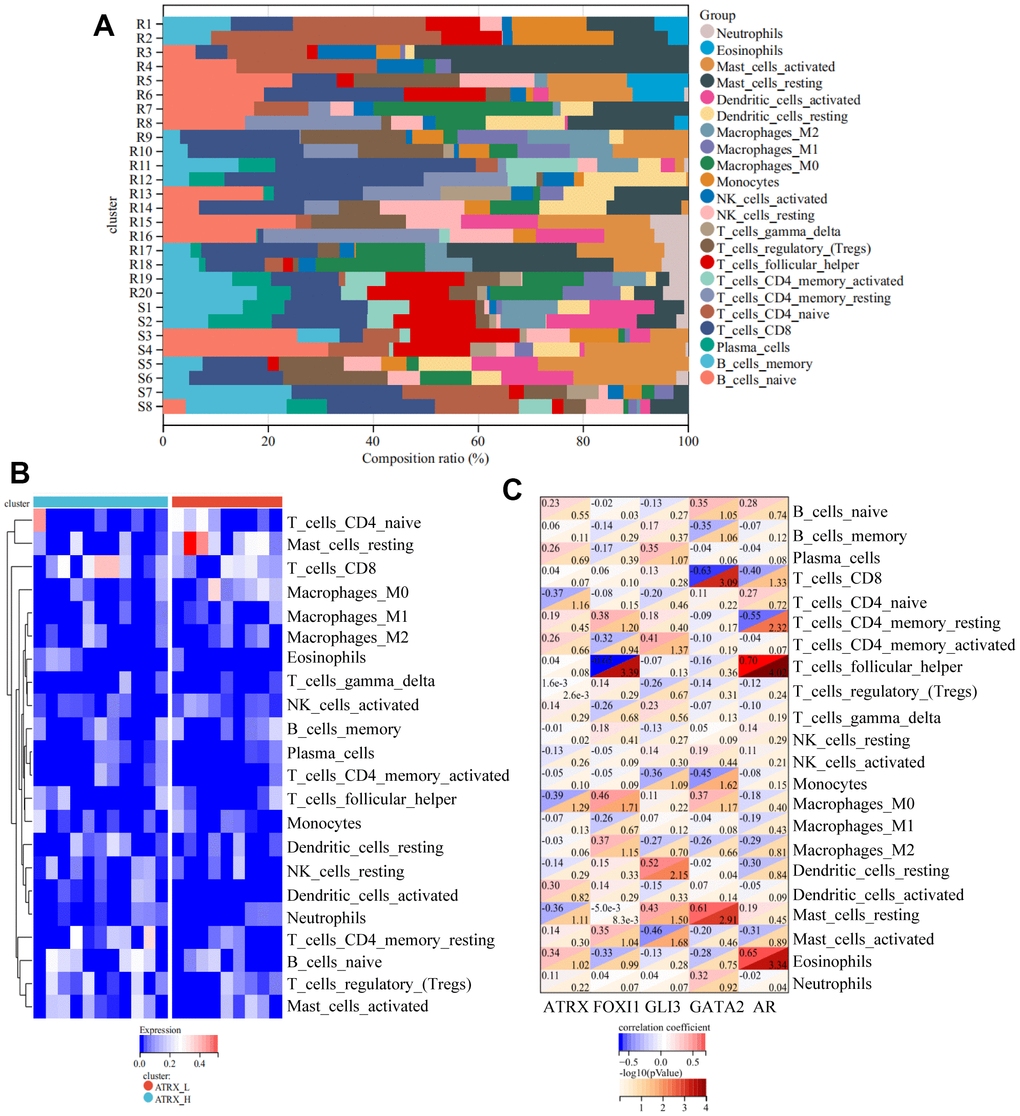
Figure 5.Immune analyses for GSE22513. (A) CIBERSORT analysis for 22 immunity cells. (B) ssGSEA revealed the difference in the 22 immunity cells between the ATRX-High and ATRX-Low groups. (C) Relationship between the five genes and immunity cells.
Figure 5 — ATRX is a predictive marker for endocrinotherapy and chemotherapy resistance in HER2-/HR+ breast cancer through the regulation of the AR, GLI3 and GATA2 transcriptional network | Aging