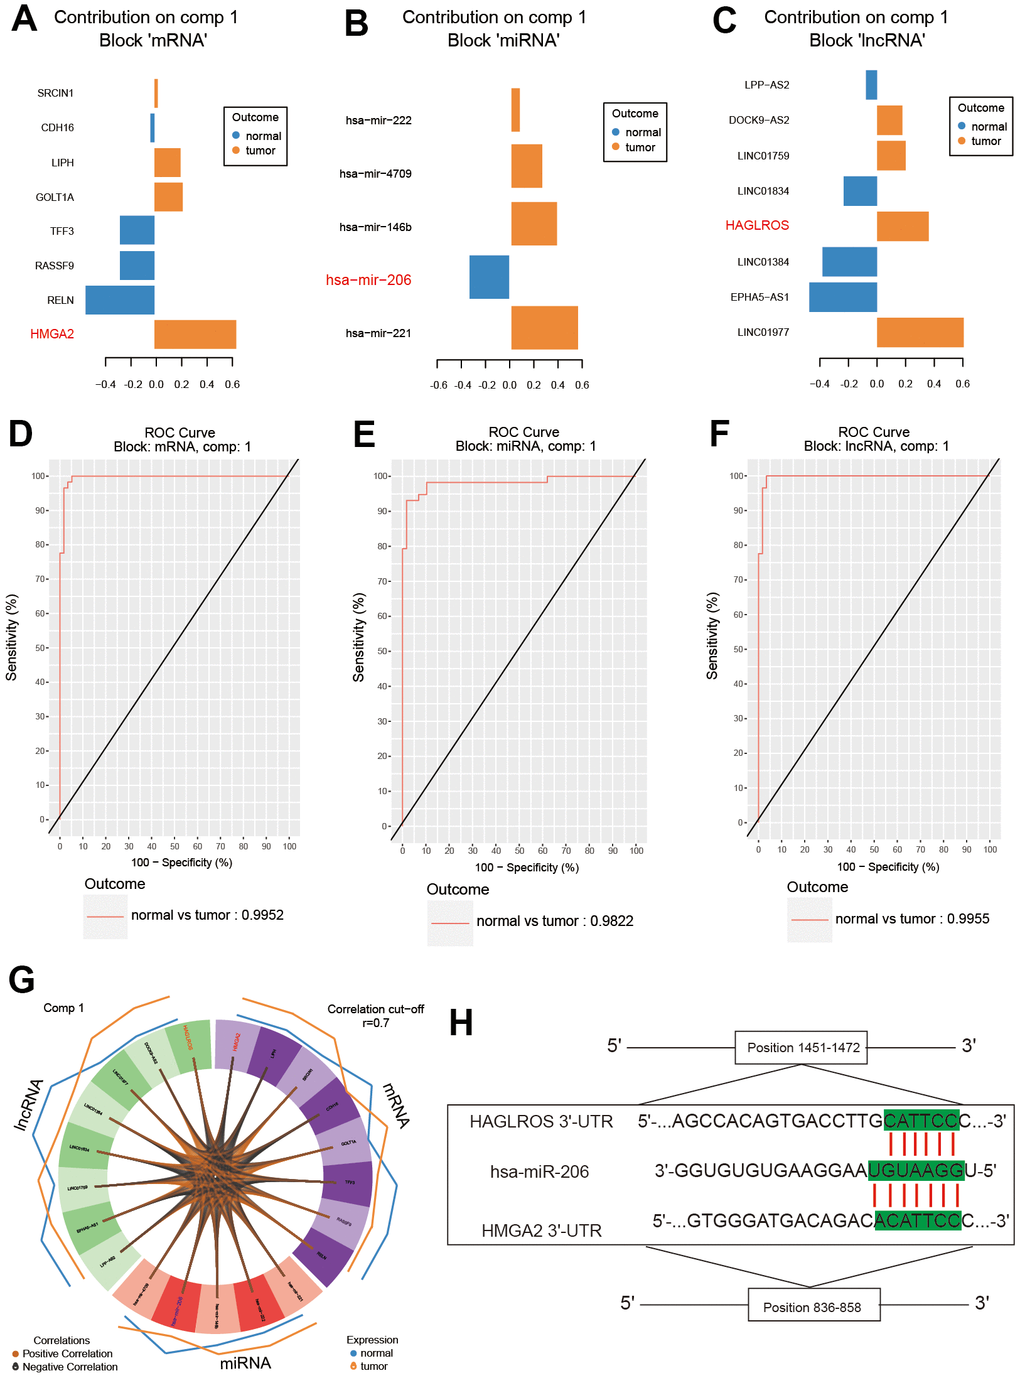
Figure 2.Analysis of the results of differential expression. (A–C) LncRNA HAGLROS, miR-206 and HMGA2 were selected based on differential expression. (D–F) ROC curves for lncRNA HAGLROS, miR-206 and HMGA2. (G) The correlations between differentially expressed RNAs in PTC and normal tissues. (H) Possible binding sites among LncRNA HAGLROS, miR-206 and HMGA2.