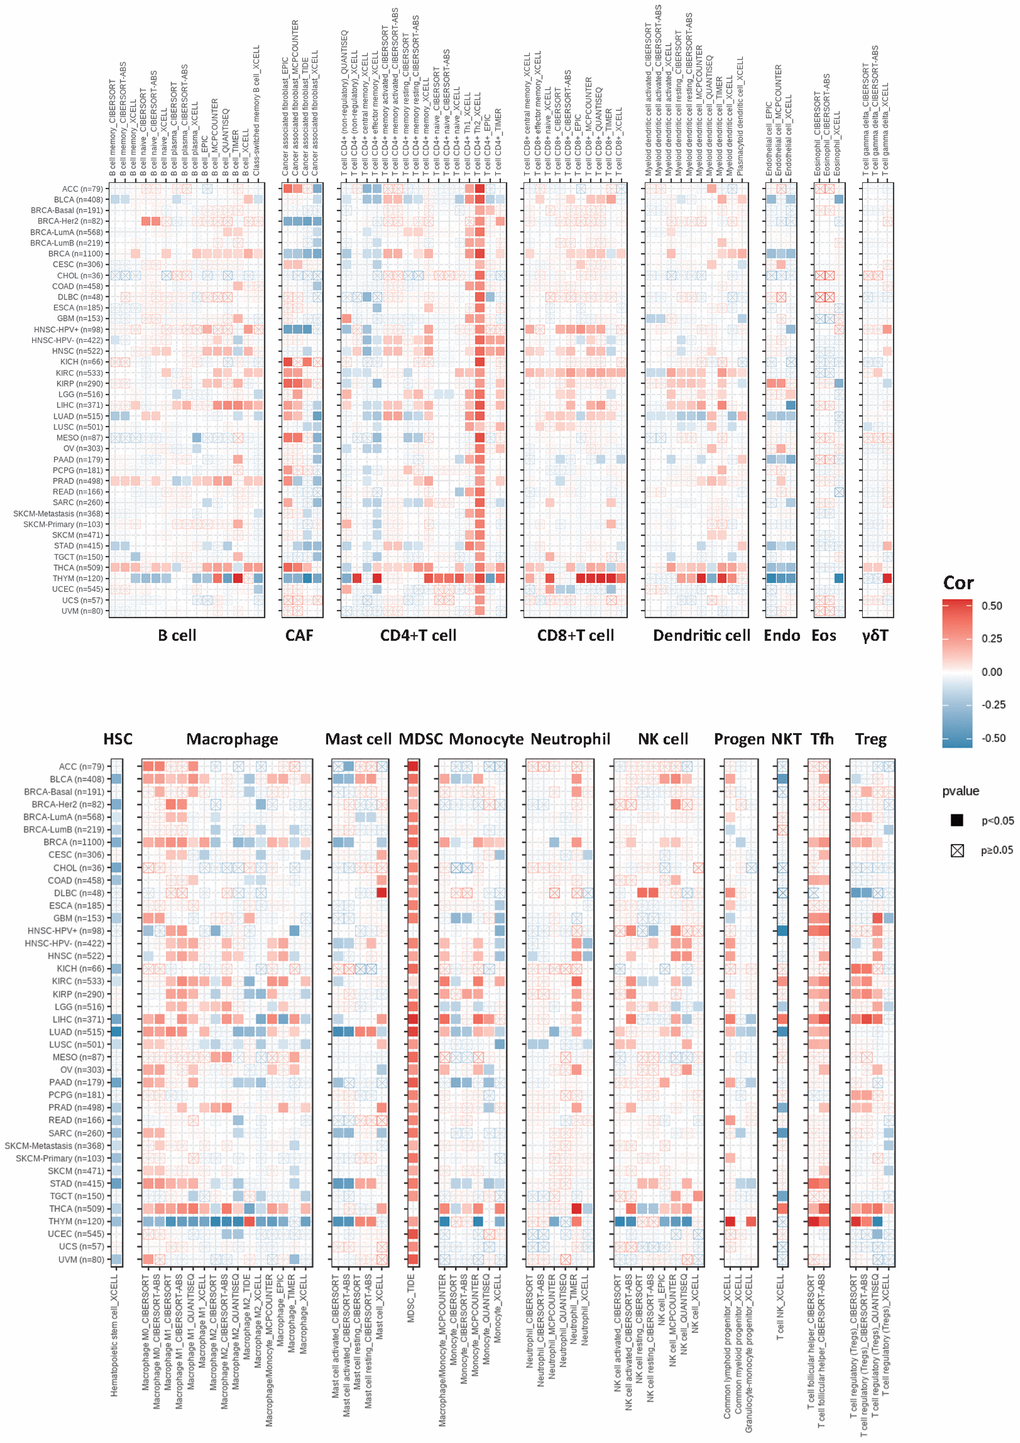
Figure 4.The correlations of KIFC1 expression and the infiltration levels of B cells, CAFs, CD4+ T cells, CD8+ T cells, dendritic cells, Endo, Eos, γδT cells, HSCs, macrophages, mast cells, myeloid-derived suppressor cells (MDSCs), monocytes, neutrophils, lymphoid progenitor cells, myeloid progenitor cells, monocyte progenitor cells, Tfh, NK T cells, and Tregs. Positive correlation in red and negative correlation in blue.