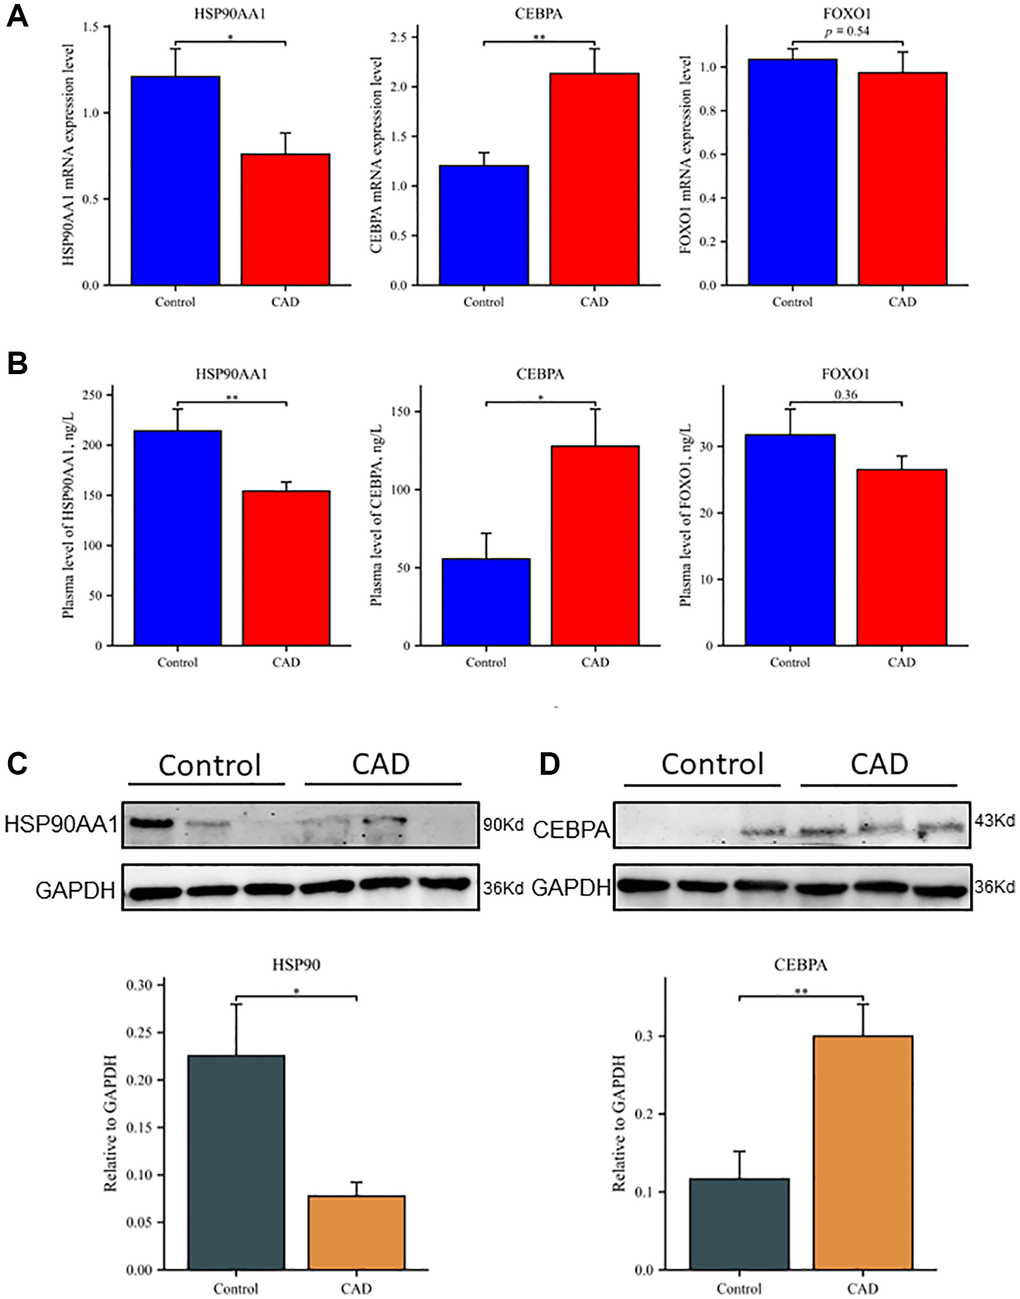
Figure 6.Differential expression of hub genes at transcription and translation levels in clinical samples. (A) Relative mRNA levels of HSP90AA1, CEBPA, and FOXO1 by RT-qPCR analysis in whole blood among controls (n = 50) and patients with CAD (n = 50). (B) Plasma expression levels of HSP90AA1, CEBPA, and FOXO1 in controls and patients with CAD. (C) Western blot analyses of HSP90AA1 protein levels in PBMCs, including representative blot images and a densitometric summary of the blot analysis after normalization to GAPDH. (D) Western blot analyses of CEBPA protein levels in PBMCs, including representative blot images and a densitometric summary of the blot analysis after normalization to GAPDH. *P < 0.05, **P < 0.01. Vertical bars represent standard error.