Submit an Article
Navigate
Home
Editorial Board
Editorial Policies
Current Volume
Archive
Scientific Integrity
Publication Ethics Statements
Interviews with Outstanding Authors
Newsroom
Sponsored Conferences
Podcast
Contact
Special Collections
Submit an Article
Online ISSN: 1945-4589
Research Paper
|
Volume 15, Issue 24
|
pp. 14803–14829
Investigating the ID3/SLC22A4 as immune-related signatures in ischemic stroke
Back to article
Figure 9
(9 of 9)
−
100%
+
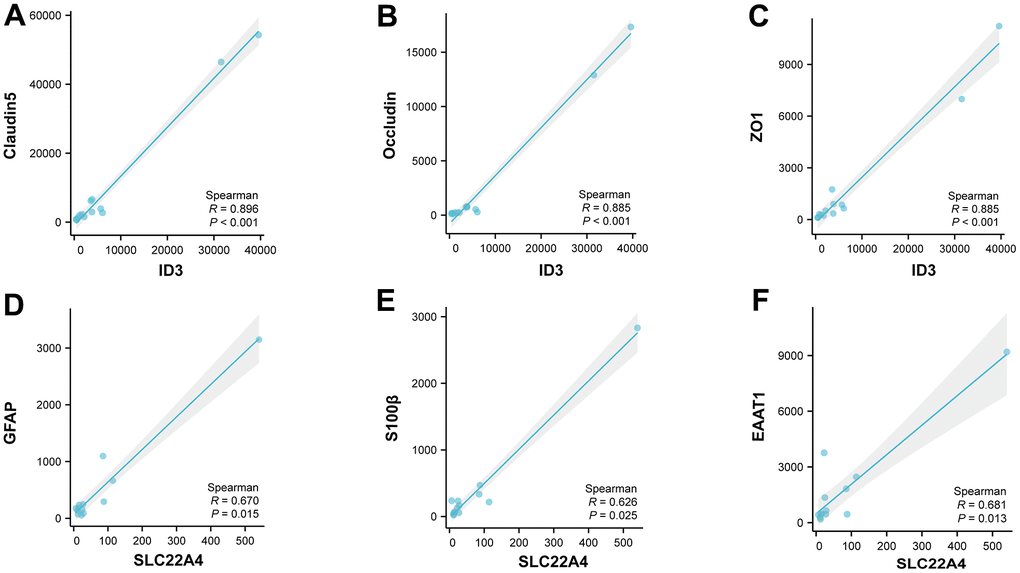
Figure 9.
Correlation analysis based on the single cell level.
(
A
–
C
) Correlation analysis of ID3 with Claudin5, Occludin and ZO1 in vascular endothelial cells. (
D
–
F
) Correlation analysis of SLC22A4 with GFAP, S100β and EAAT1 in astrocytes.