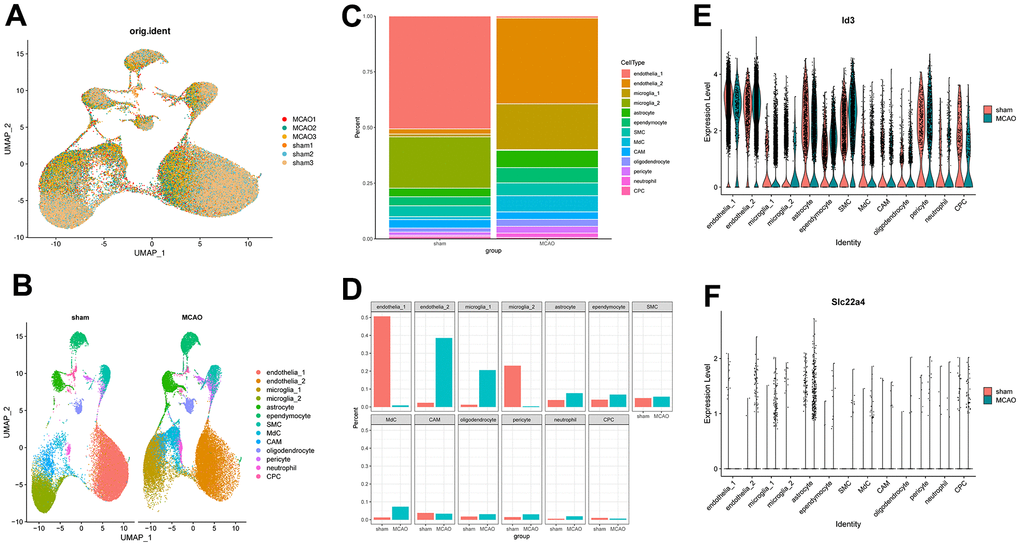
Figure 8.Mouse brains’ scRNA-seq demonstrates transcriptome atlas. (A) UMAP plot for visualizing clustering profiles between MCAO and sham groups. (B) The UMAP plots display clustering of single cells by types. (C) The proportion of cells in each sample for each cluster is shown in a bar plot. (D) Visualizing the number of cells in each sample for each cluster. (E, F) Violin plots showing ID3 and SLC22A4 expression levels in the above 13 clusters.