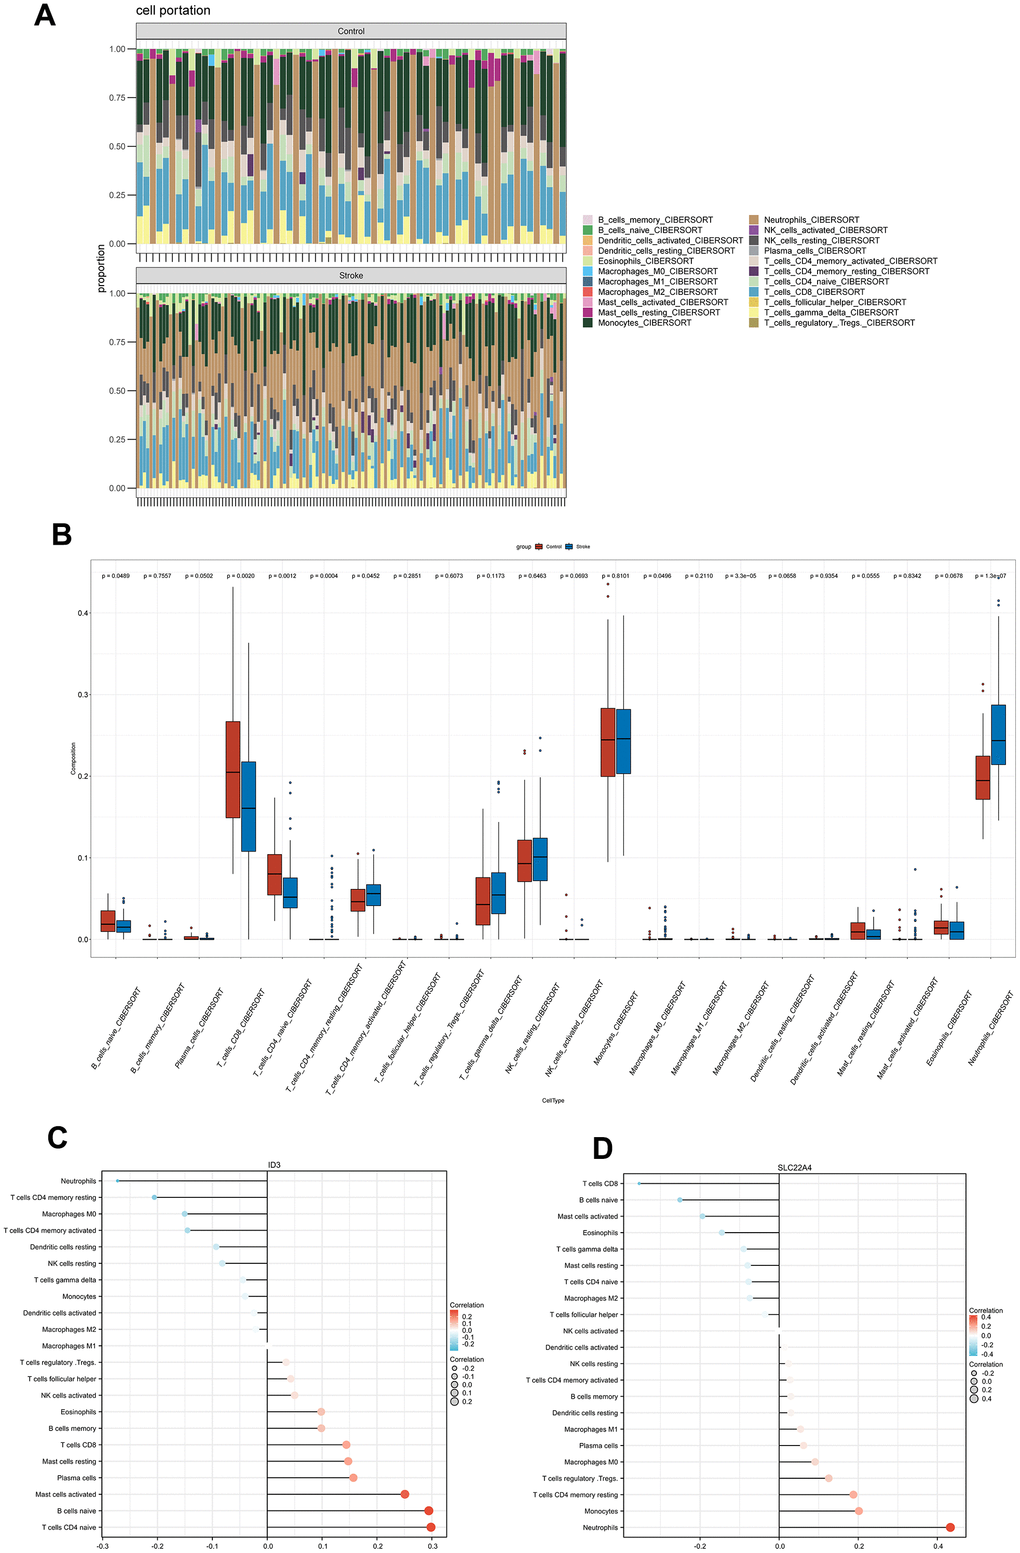
Figure 7.Immune infiltration characteristics. (A) A bar plot shows the relative percentage of 22 immune cell subsets. (B) Comparison of immune cells infiltrating IS patients and controls. (C, D) A Spearman correlation of immune cell subsets and ID3; SLC22A4. The color and size of the dots indicate the strength of the correlation.