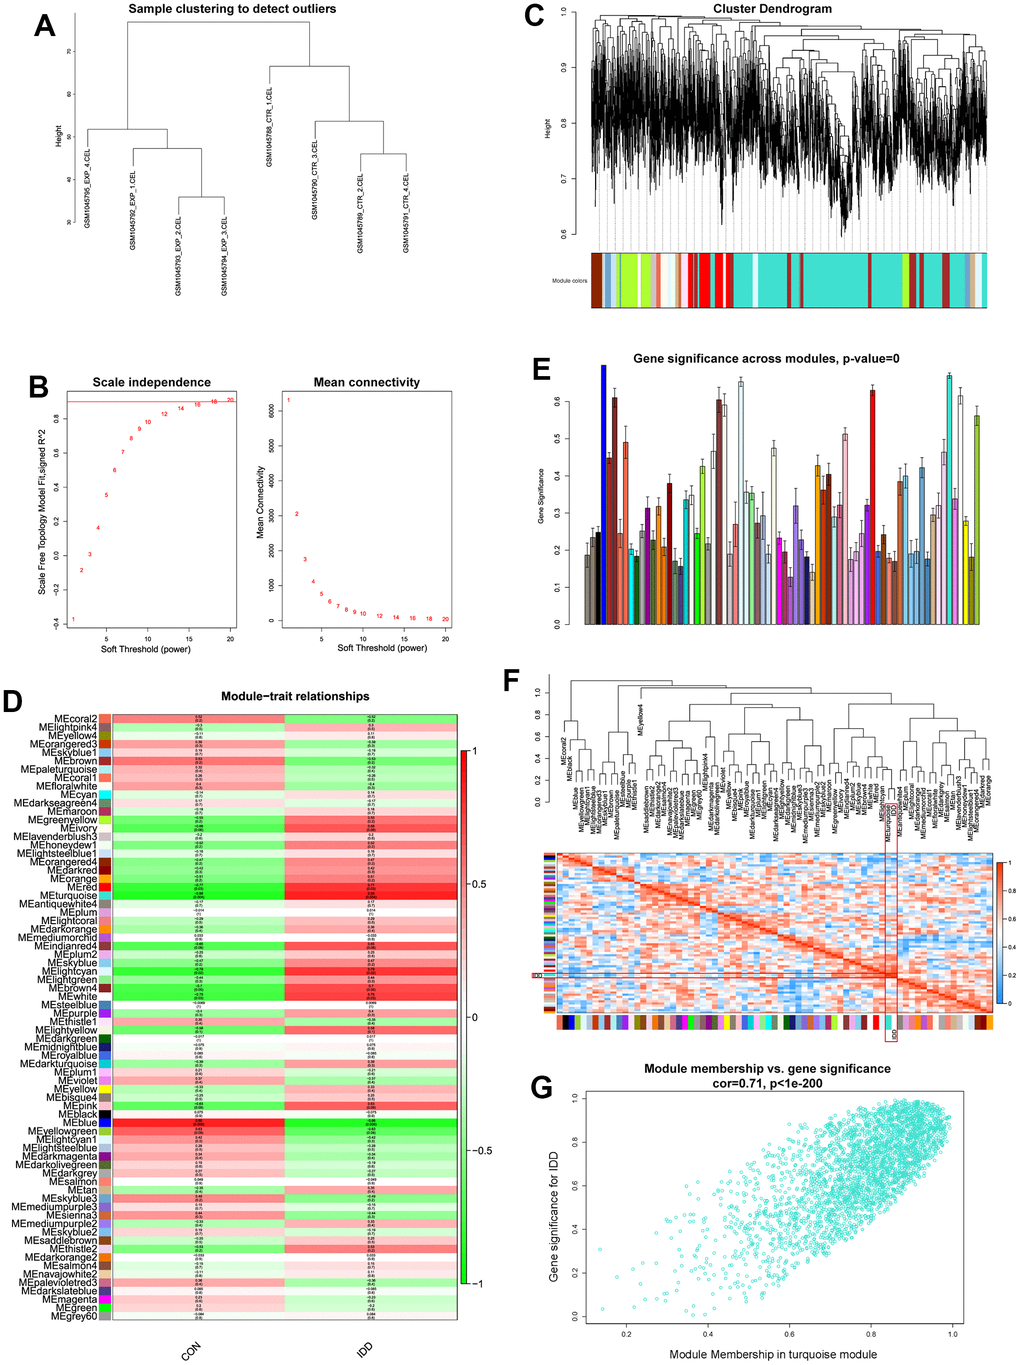
Figure 1.(A) Sample clustering analysis to detect the outliers. (B) Determination of soft threshold power value. Left panel indicated scale-free model fit index; right panel indicated the mean connectivity of these values. (C) Dendrogram branch plot of genes based on dissimilarity measure and assignment modules. (D) Module-trait correlation heatmap between different clinical traits and modules. (E) Gene significance histogram plot of all clustered modules. (F) Eigenvalue correlation heatmap of the modules and clinical traits. (G) Correlation scatter plot between gene-significance and module membership.