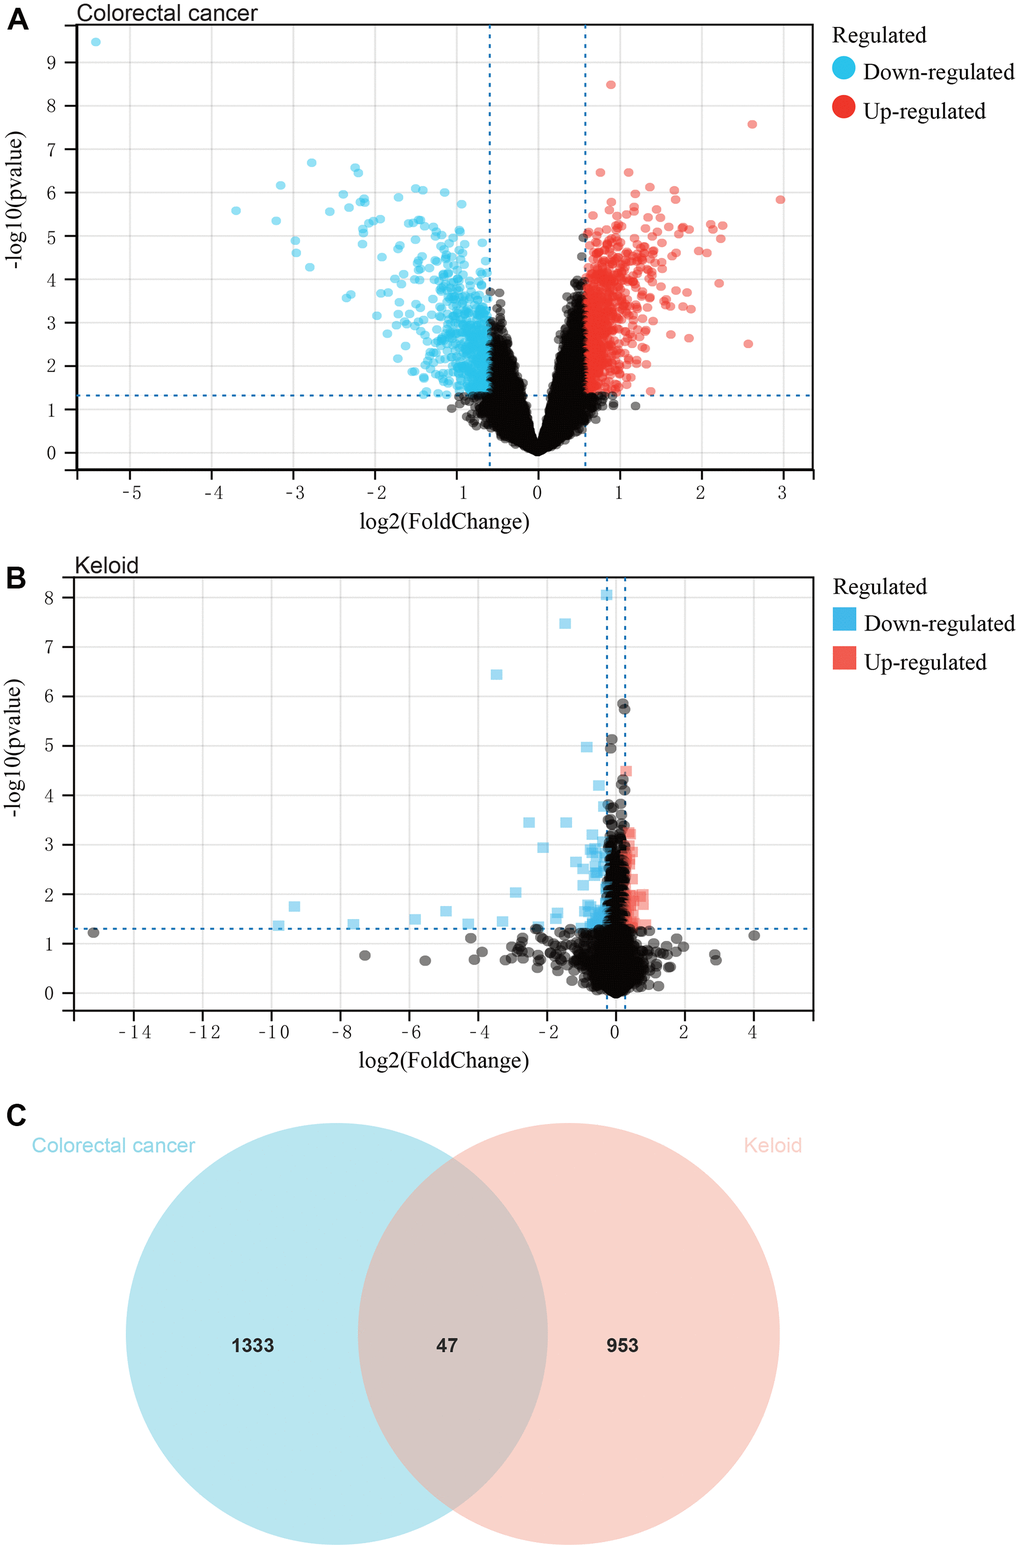
Figure 1.Analysis of differentially expressed genes. (A) The colorectal cancer dataset, and a total of 1380 DEGs. (B) The keloid dataset, and a total of 1000 DEGs. (C) The intersection of differential genes of colorectal cancer and keloid was used to obtain the Venn diagram.