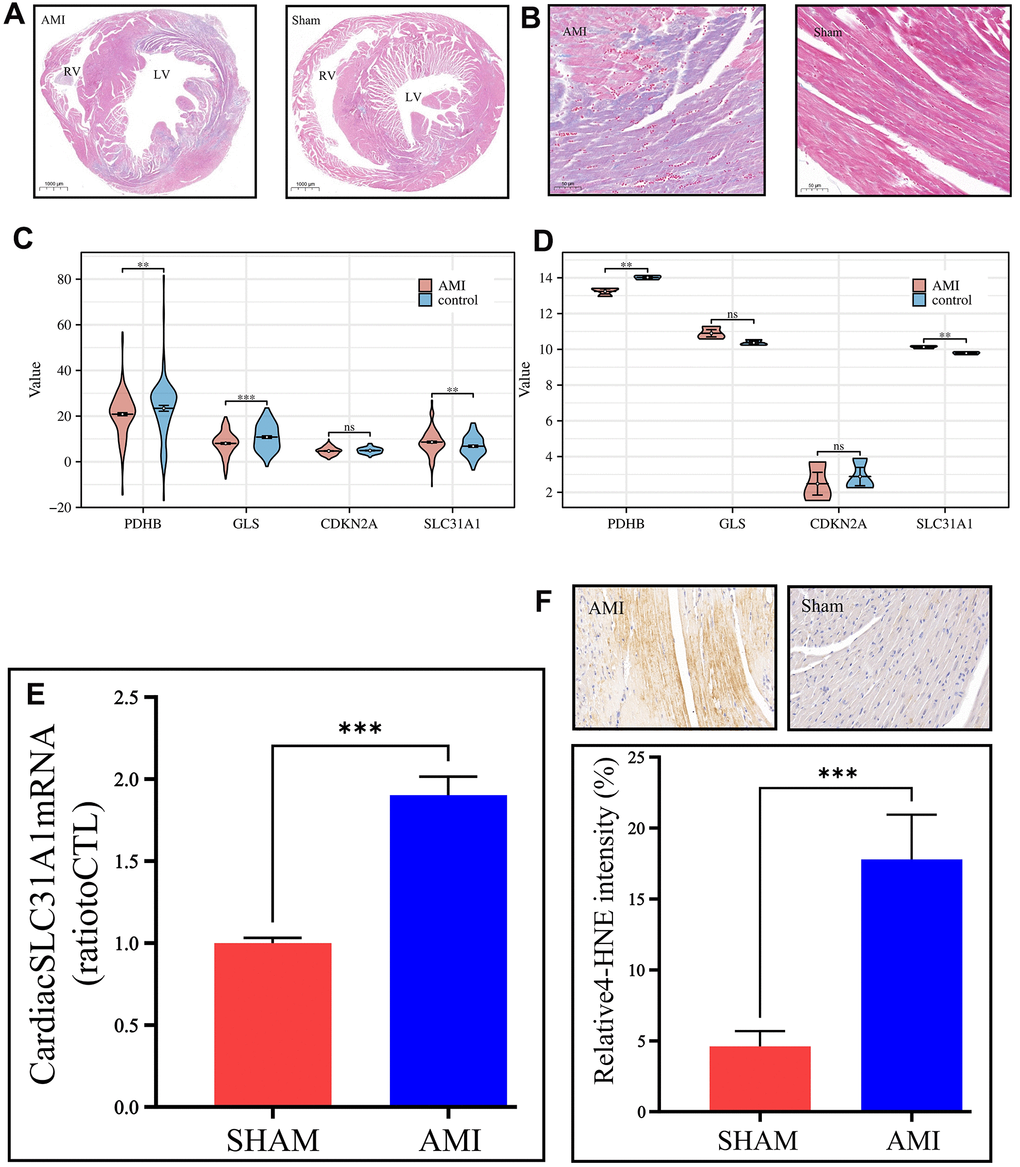
Figure 5.In vivo validation of the expression of the contributor genes, with a focus on the SLC31A1 gene. (A) Masson staining slides on a macroscopic view, demonstrating the coronal section of the mice’s hearts. The left panel is the AMI sample, and the right panel is the Sham sample. RV: right ventricle, LV: left ventricle. (B) Masson staining slides of the coronary heart section of the AMI group and Sham group under magnification. The purplish color indicates hypoxia, thus the area of AMI. The deeper the color, the more severe infarction. (C, D) Expression analysis of the contributor genes in the form of violin plots in the merged GEO dataset and our own bulk RNA sequencing cohort, respectively. (E) qPCR results of the SLC31A1 gene expression. (F) Upper panel: immunohistochemical staining of the SLC31A1 protein in the AMI group and Sham group. The more brownish color, the more abundant the SLC31A1 protein. Lower panel: quantitative analysis of the immunohistochemical staining for the SLC31A1 protein in the AMI group and Sham group in the manner of bar plot.