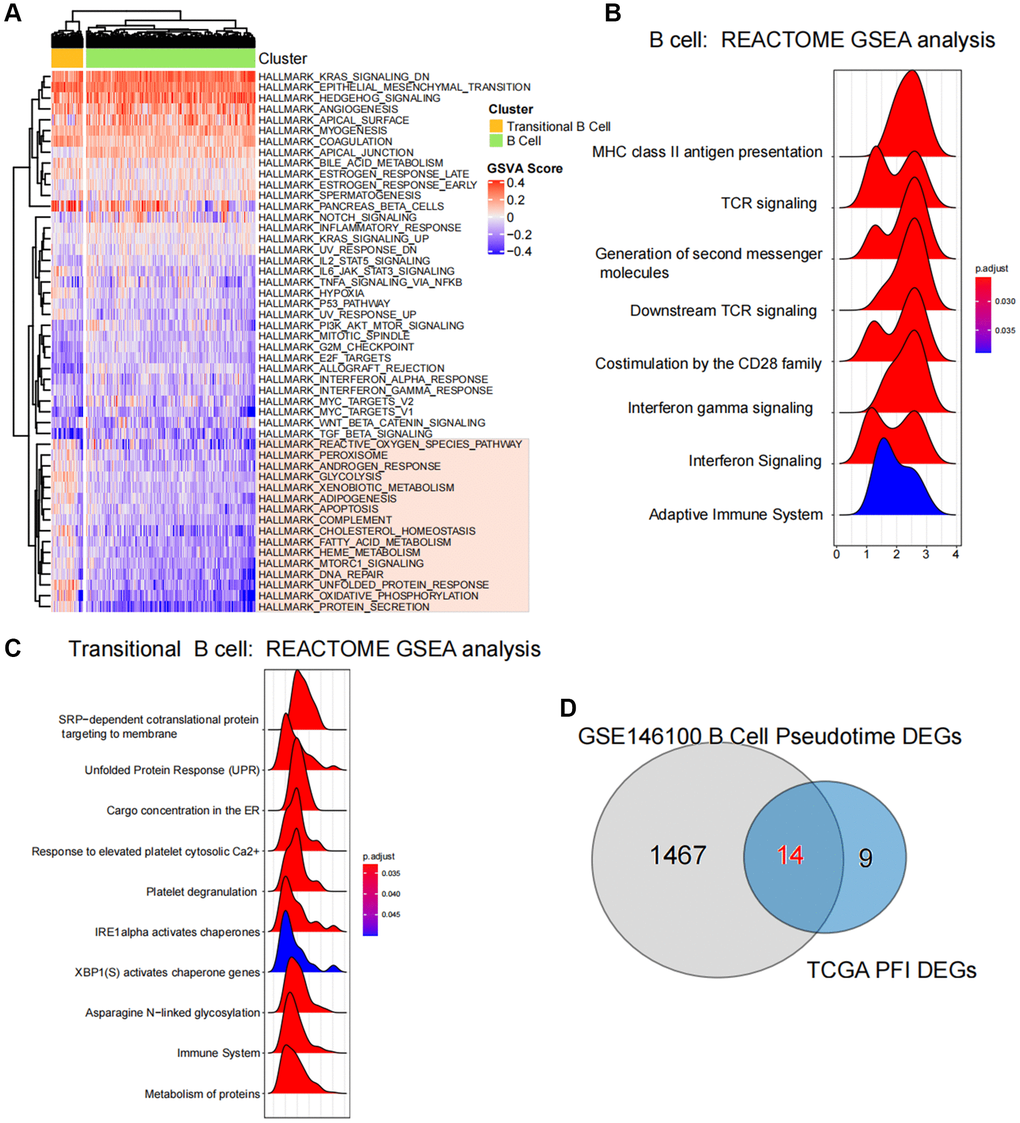
Figure 5.Enrichment and variability analysis of B-cell subpopulation pathways. (A) Variability scores of B cell subpopulations and Transitional B cells in the Hallmark gene set pathway. (B, C) Results of enrichment significance of B cell subpopulations and Transitional B cells at the REACTOME gene set level. (D) Intersection analysis of pseudotime regulatory genes of B-cell subpopulations and ferroptosis-related differential genes in TCGA.