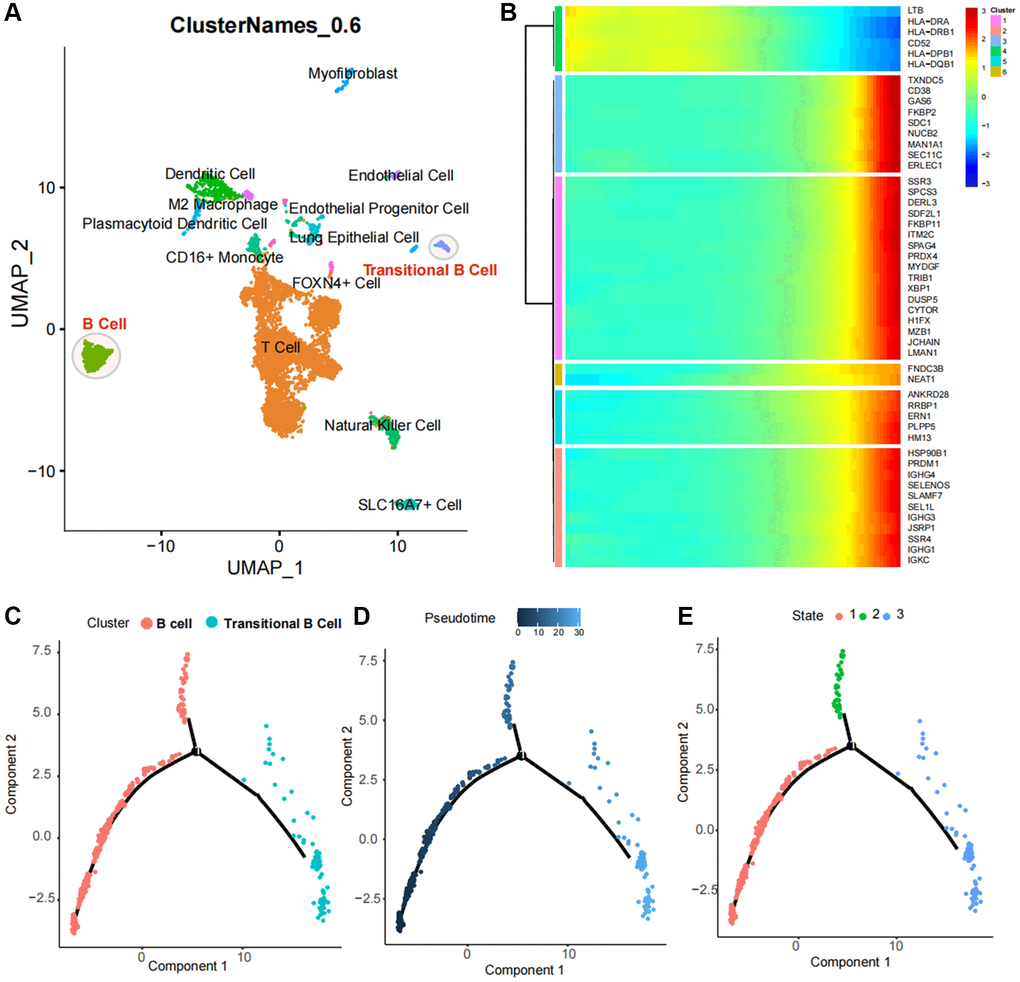
Figure 4.Identification and pseudotime analysis of single-cell subpopulations in lung cancer. (A) Identification of immune cell subpopulations in lung cancer tissues, with T cells as the major subpopulation and B cell populations with two subpopulations spaced apart in the UMAP spatial map, suggesting distinct biological functions. (B) Single-cell pseudotime analysis heat map of B-cell subpopulations. (C–E) Spatial distribution of B-cell populations and Transitional B cells in the pseudotime analysis atlas.