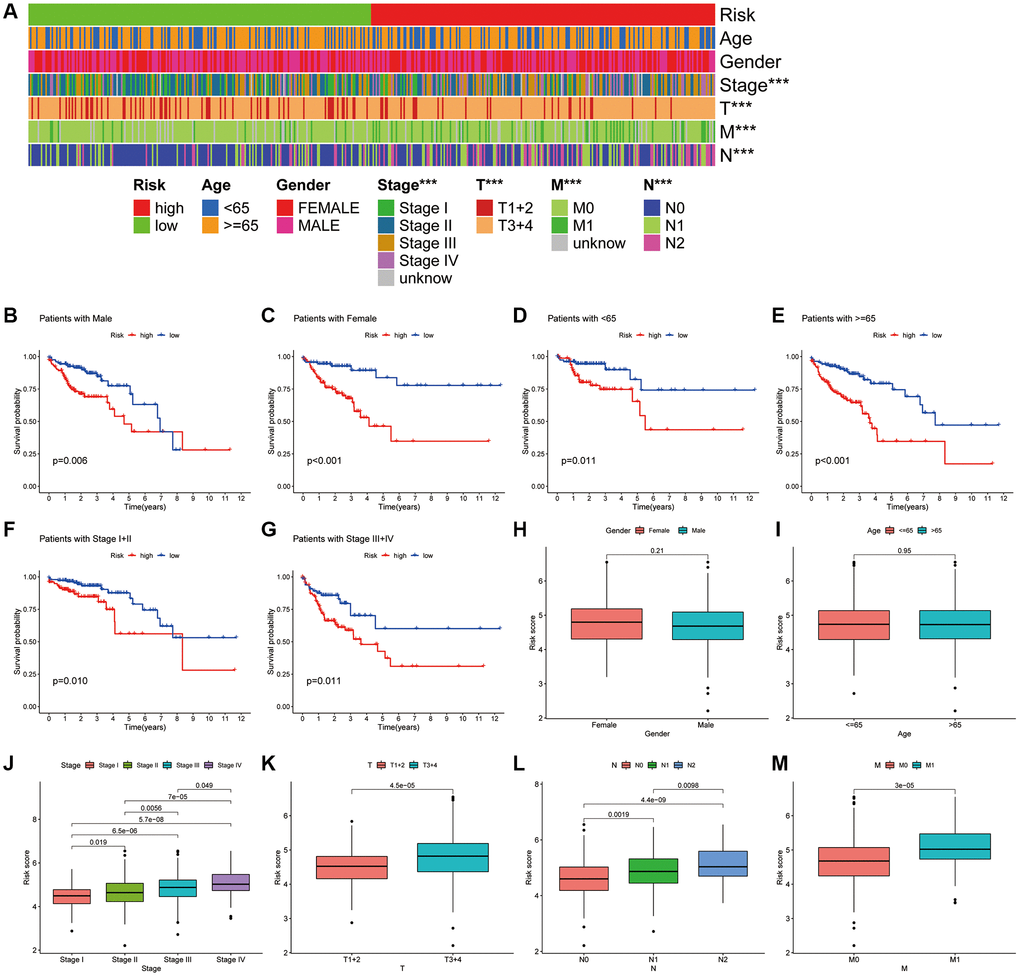
Figure 6.Association of CAFRs with clinicopathological parameters in COAD. (A) A strip chart of the associations between risk status and clinical parameters. (B–G) K–M curves of low- and high-risk subgroups sorted by gender, age and TNM stage. (H–M) Box plot of the difference in risk scores by gender, age, TNM-stage, T-stage, N-stage and M stage.