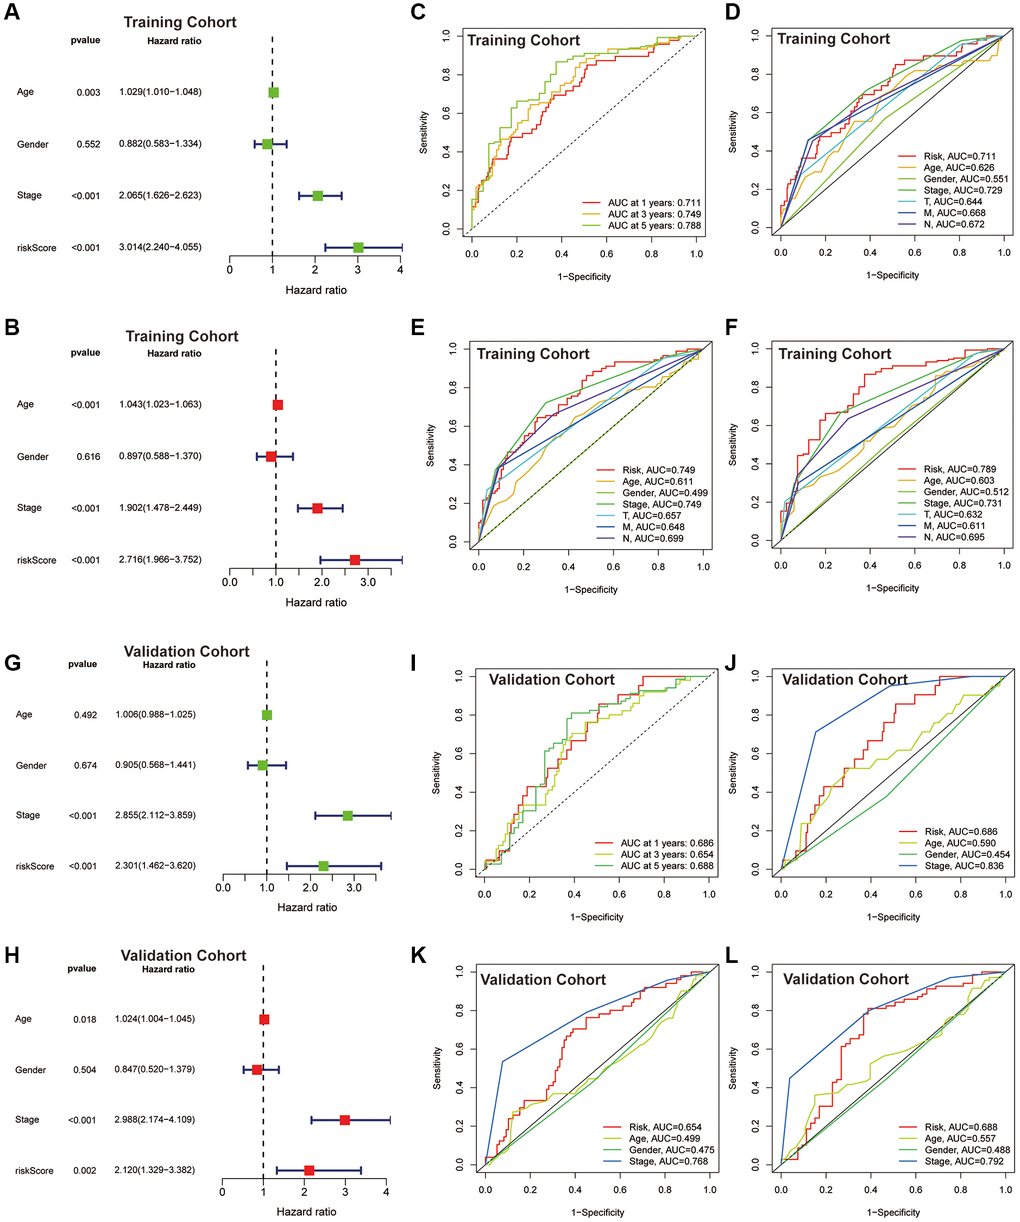
Figure 5.Assessment of the CAFRs. (A, B) Forest plot for univariate and multivariate Cox regression analyses in the TCGA-COAD cohort. (C) ROC curves of 1-, 3- and 5-year survival for the CAFRs in the TCGA-COAD cohort. (D–F) Comparison of the prediction accuracy of the CAFRs with age, gender, TNM-stage, T-stage, N-stage and M-stage at 1-, 3- and 5- years in the TCGA-COAD cohort. (G, H) Forest plot for univariate and multivariate Cox regression analyses in the GEO cohort. (I) ROC curves of 1-, 3- and 5-year survival for the CAFRs in the GEO cohort. (J–L) Comparison of the prediction accuracy of the CAFRs with age, gender and stage in the GEO cohort.