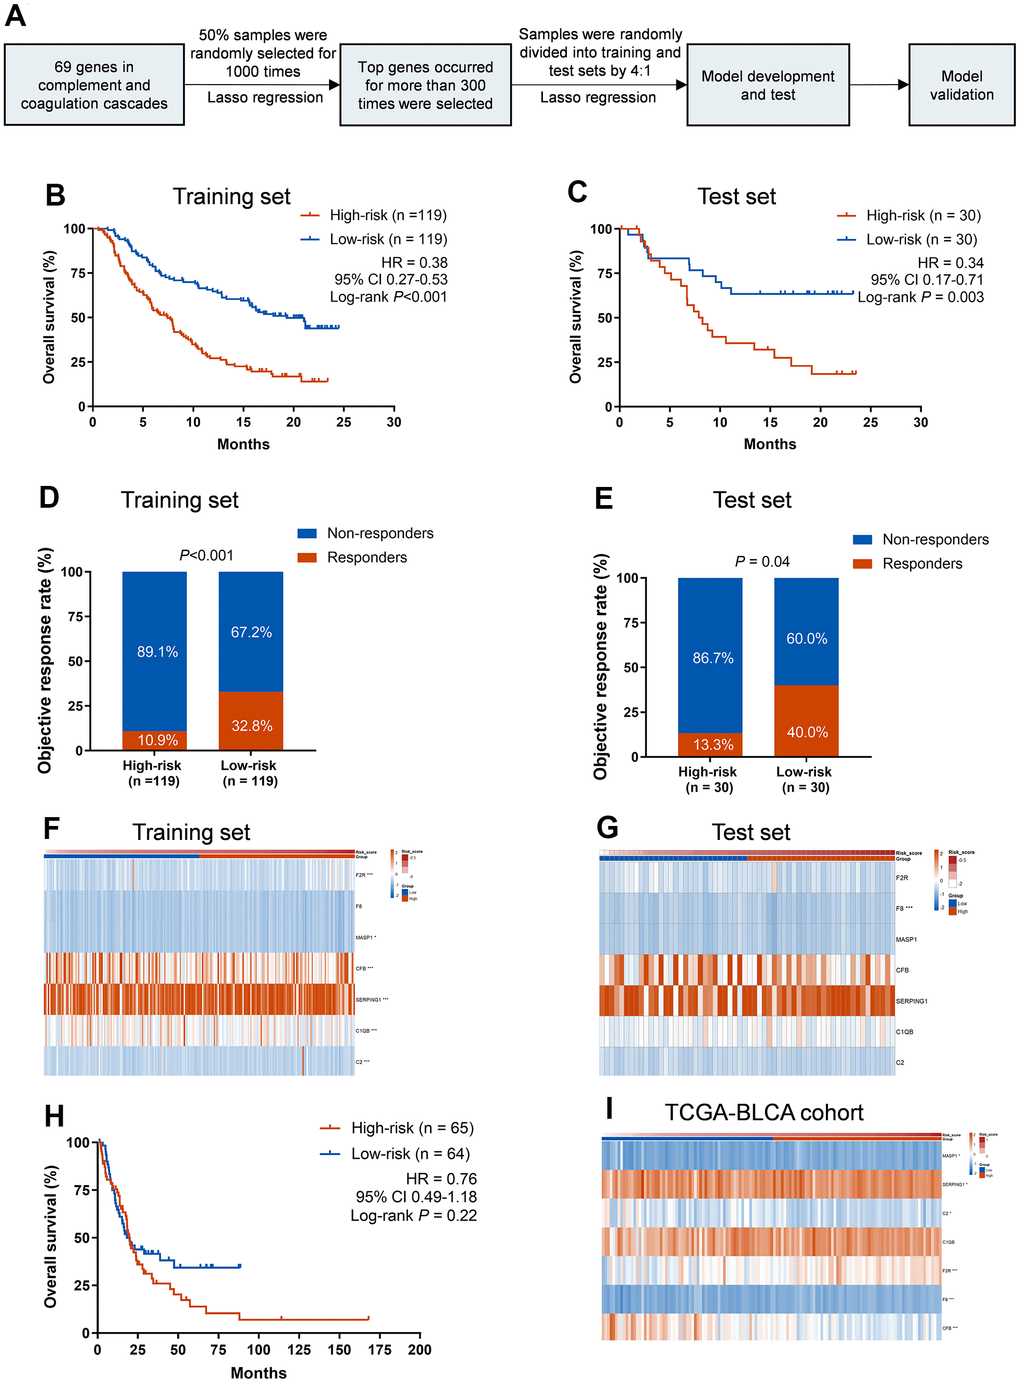
Figure 2.Training and validation of the CCCP risk score in mUC and TCGA-BLCA cohort. (A) Workflow for the construction of the CCCP risk model. (B, C) Kaplan-Meier curves of OS comparing patients with high- and low-risk in the training (B) and test sets (C). (D, E) Comparison of objective response rate between patients with high- and low-risk in the training (D) and test sets (E). (F, G) Heatmaps depicting the expression of the seven core genes from CCCP in patients with high- and low-risk in the training (F) and test sets (G). (H) Kaplan-Meier curves of OS comparing patients with high- and low-risk in TCGA-BLCA cohort (I) Heatmap depicting the expression of the seven core genes from CCCP in patients with high- and low-risk in TCGA-BLCA cohort. CCCP, complement and coagulation cascades pathway; mUC, metastatic urothelial carcinoma; OS, overall survival.