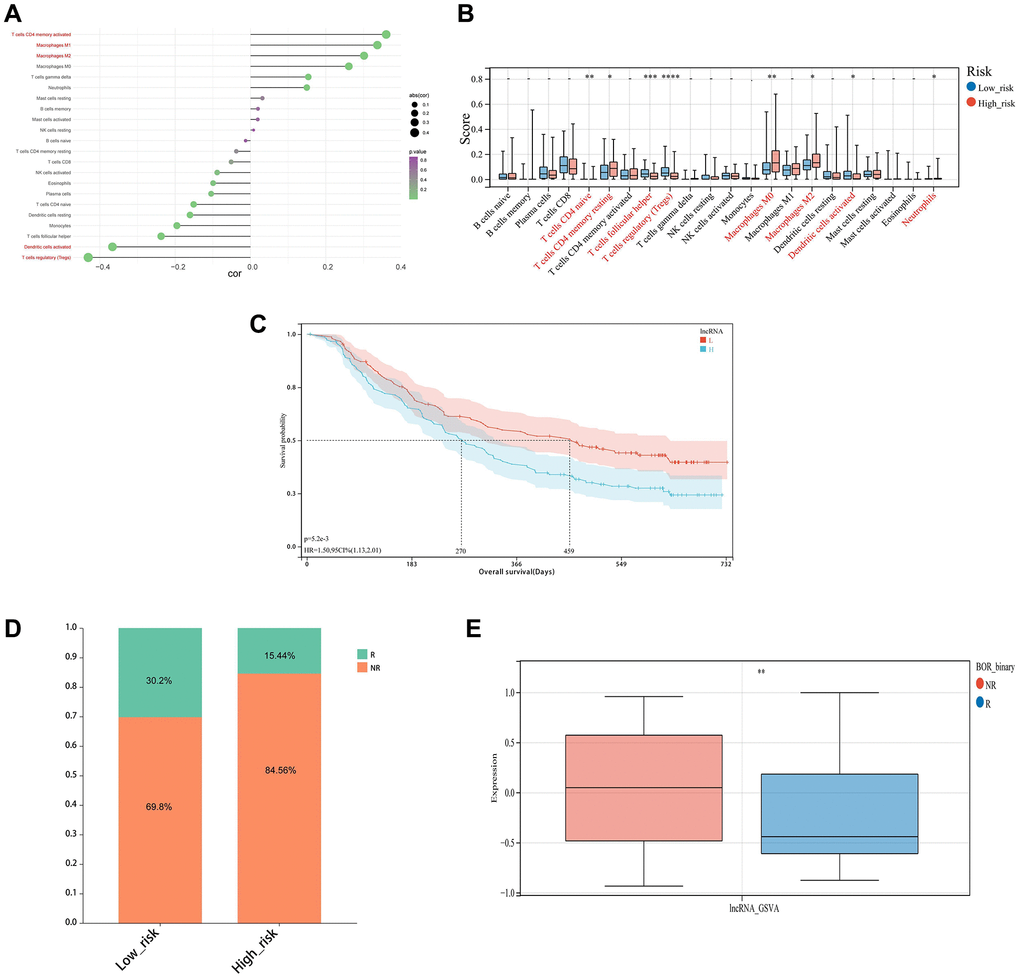
Figure 9.Immune infiltration analysis and immunotherapy response. (A) Correlation chart between risk score and immune infiltration cells. (B) The relative proportions of 22 kinds of immune cells in the two risk subgroups. (C) KM survival curves for overall survival between the high and low-risk groups in the IMvigor210 cohort. (D, E) Differences of non-responders and responders to immunotherapy response between high and low-risk groups in the IMvigor210 cohort.