Submit an Article
Navigate
Home
Editorial Board
Editorial Policies
Current Volume
Archive
Scientific Integrity
Publication Ethics Statements
Interviews with Outstanding Authors
Newsroom
Sponsored Conferences
Podcast
Contact
Special Collections
Submit an Article
Online ISSN: 1945-4589
Research Paper
|
Volume 15, Issue 16
|
pp. 8384–8407
Prognosis analysis and validation of lipid metabolism-associated lncRNAs and tumor immune microenvironment in bladder cancer
Back to article
Figure 8
(8 of 12)
−
100%
+
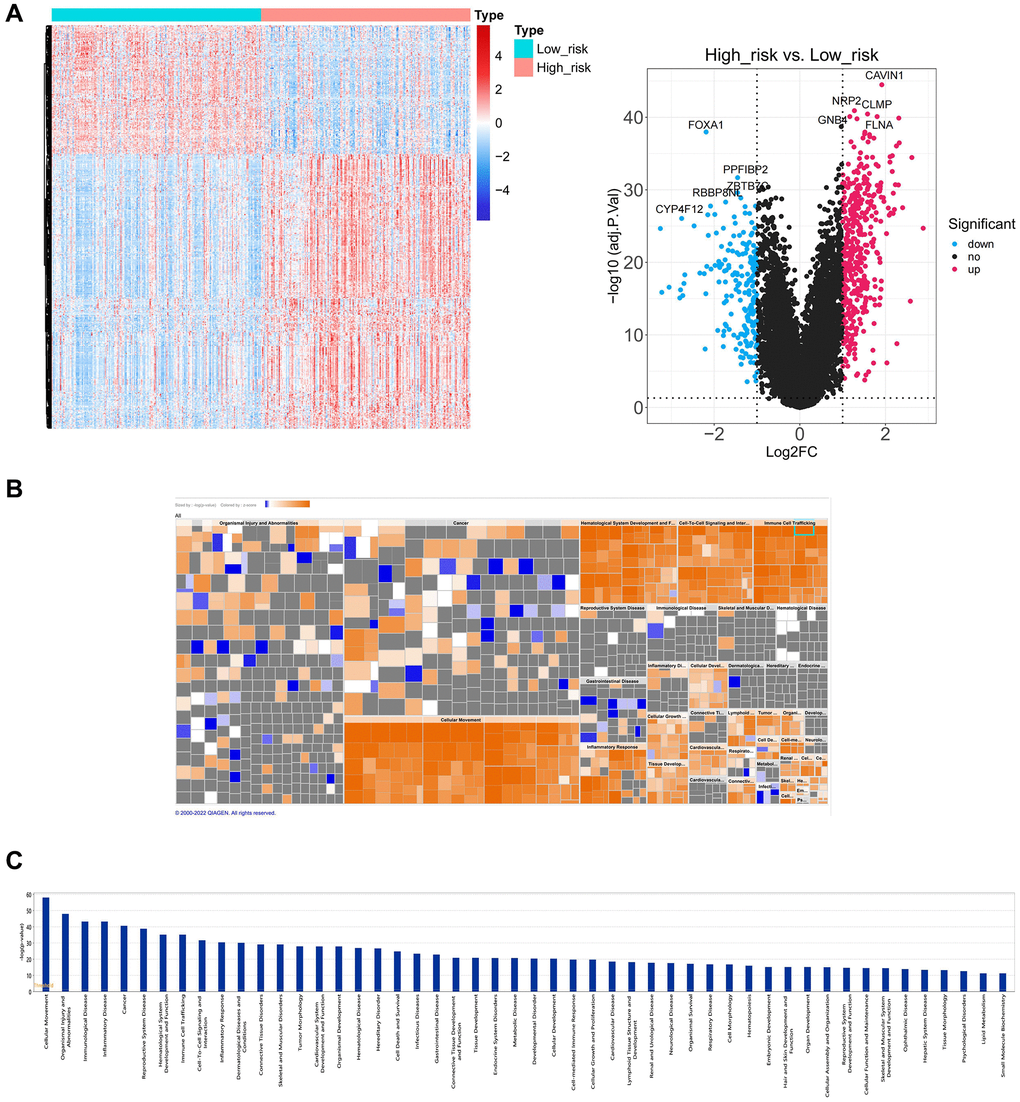
Figure 8.
Functional enrichment analysis between high and low-risk groups.
(
A
) The heatmap plot and volcano diagram show the DEGs between patients in high and low-risk groups. (
B
,
C
) IPA analysis shows 620 DEGs significantly acted in 50 pathways.