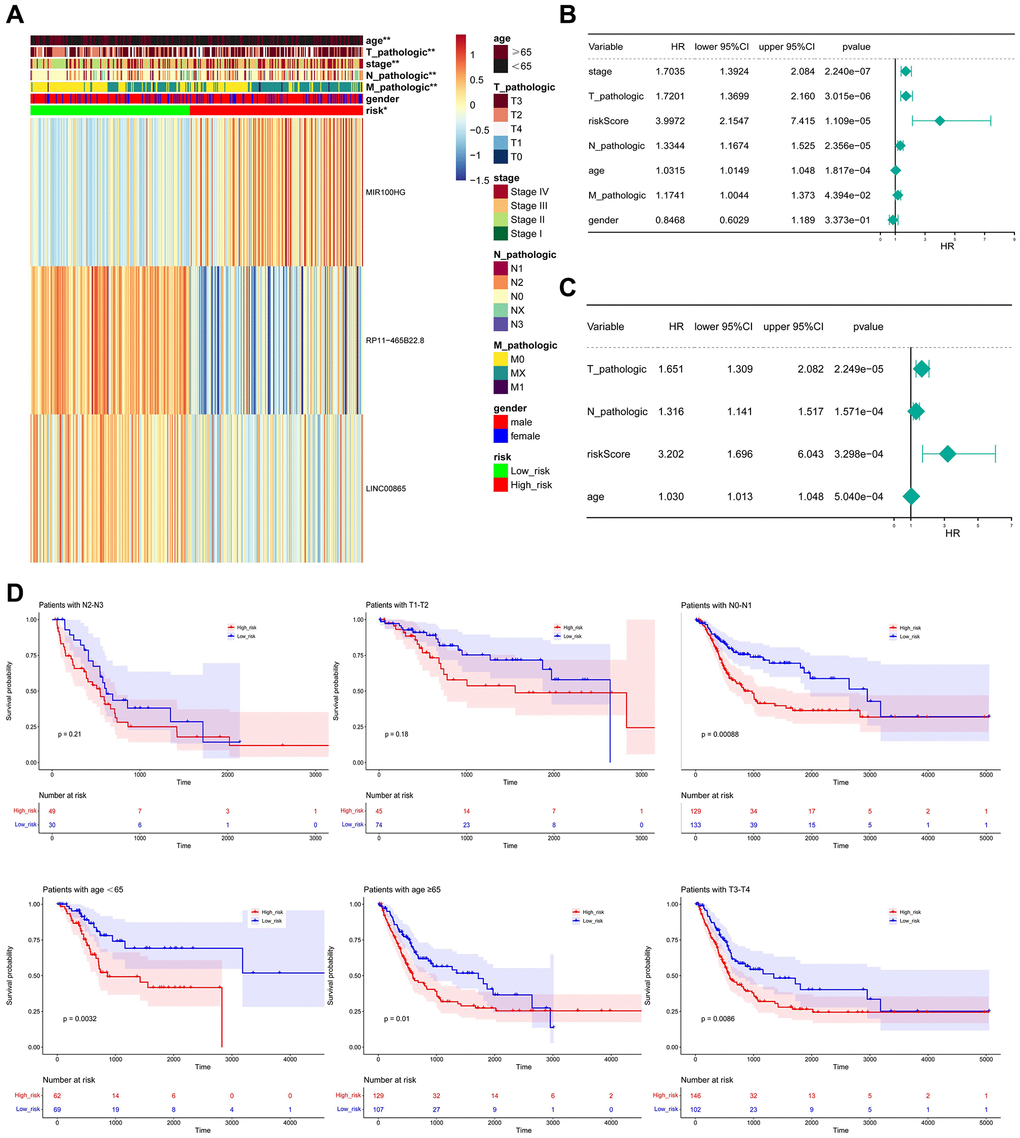
Figure 7.Relationship between risk score and clinicopathological characteristics. (A) The heatmap shows the relationship among gender, age, grade, T stage, N stage, M stage, tumor stage, and risk score. (B, C) Univariate and multivariate assays identified independent prognostic factors in BLCA patients. (D) KM survival curve for high and low-risk groups in independent prognostic factors.