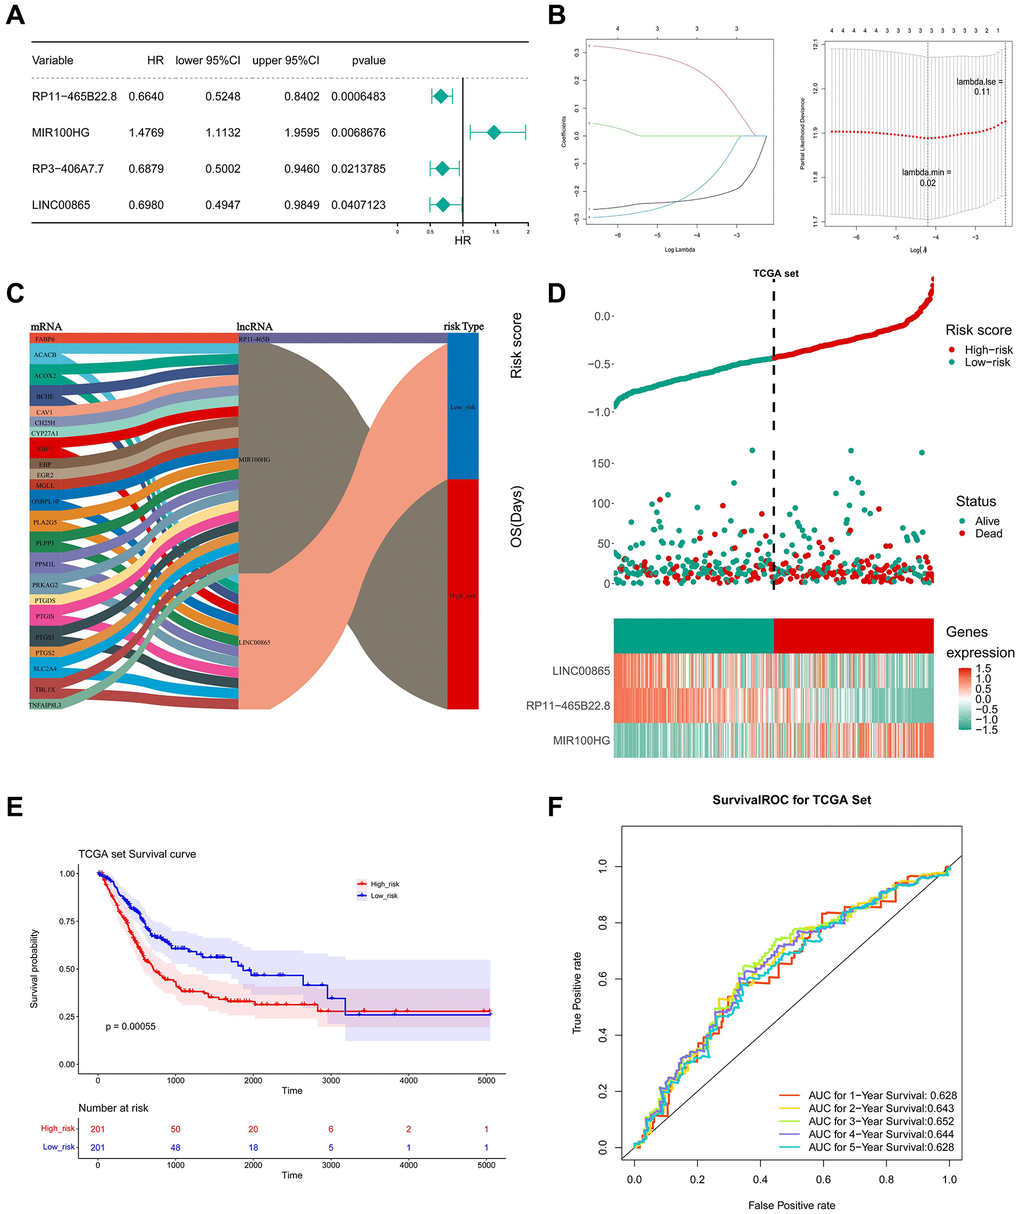
Figure 5.Construction and evaluation of LMRLs-based prognostic signature. (A) The LMRLs associated with the prognosis of BLCA patients were extracted by univariate Cox regression analysis. (B) LASSO regression analysis reserved 3 prognostic features LMRLs. (C) The Sanberry plot demonstrates lncRNA-mRNA co-expression relationships. (D) Distributions of risk score and survival status of BLCA patients and heatmap of the 3 genes signature in the training set. (E) KM survival curves for high and low-risk groups in the training set. (F) ROC curve of the 3 gene signature for predicting the 1, 3, and 5 years survival in the training set.