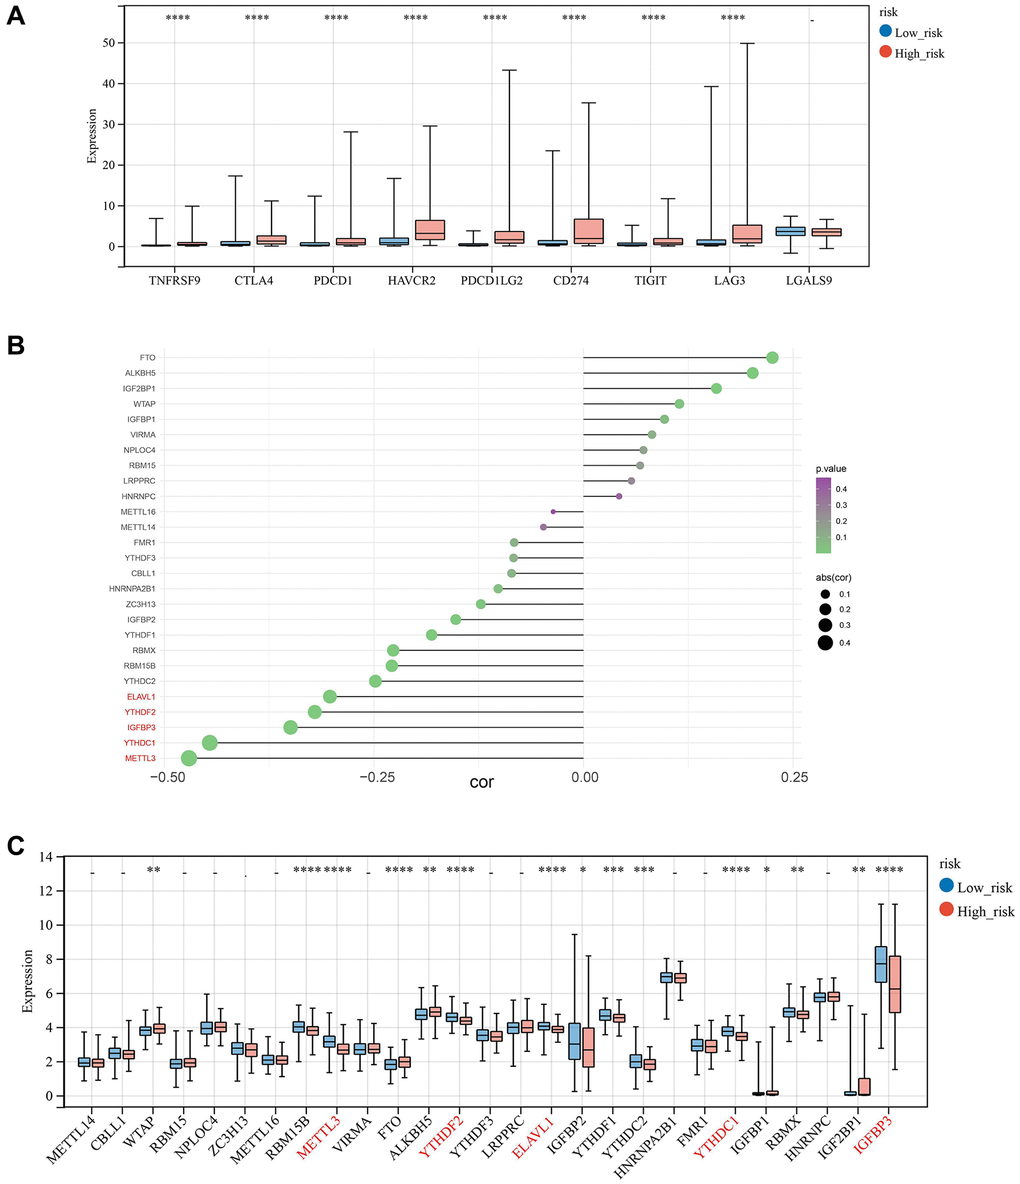
Figure 11.Correlation analysis of risk score with m6A moderators. (A) Expression of Immune-checkpoint inhibitors in high and low-risk groups. (B, C) The correlation and relative proportions between risk score and m6A moderators in the two risk subgroups.