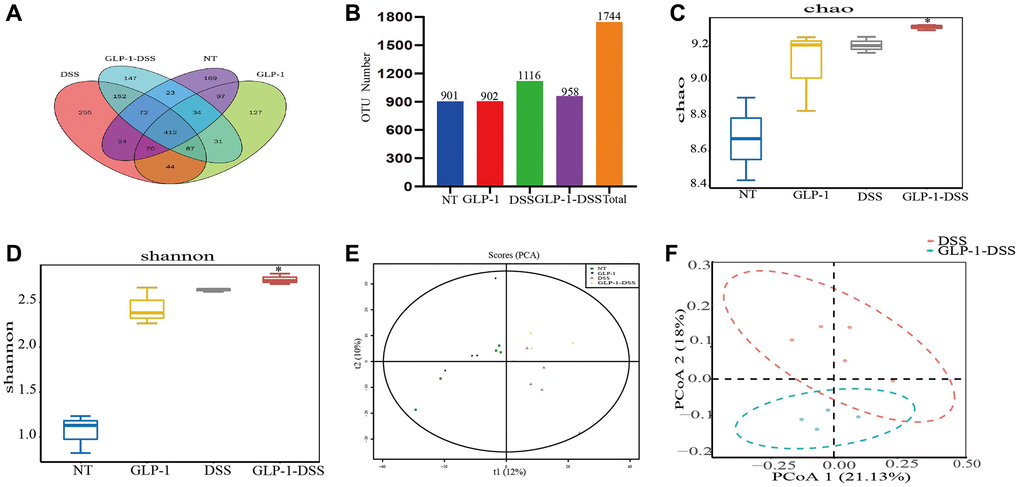
Figure 5.The effect of GLP-1 on microbial diversity. (A) OTU Venn chart. (B) The histogram of OTU number (Numbers show the total number of OTUs in each group). The α-diversity shows the community richness estimated with Chao 1 index (C) and Shannon index (D); the β diversity shows the diversity of bacteria in the cecum through PCA (E) and PCoA (F) analysis. For GLP-1-DSS vs. DSS group, *p < 0.05 was considered significant.