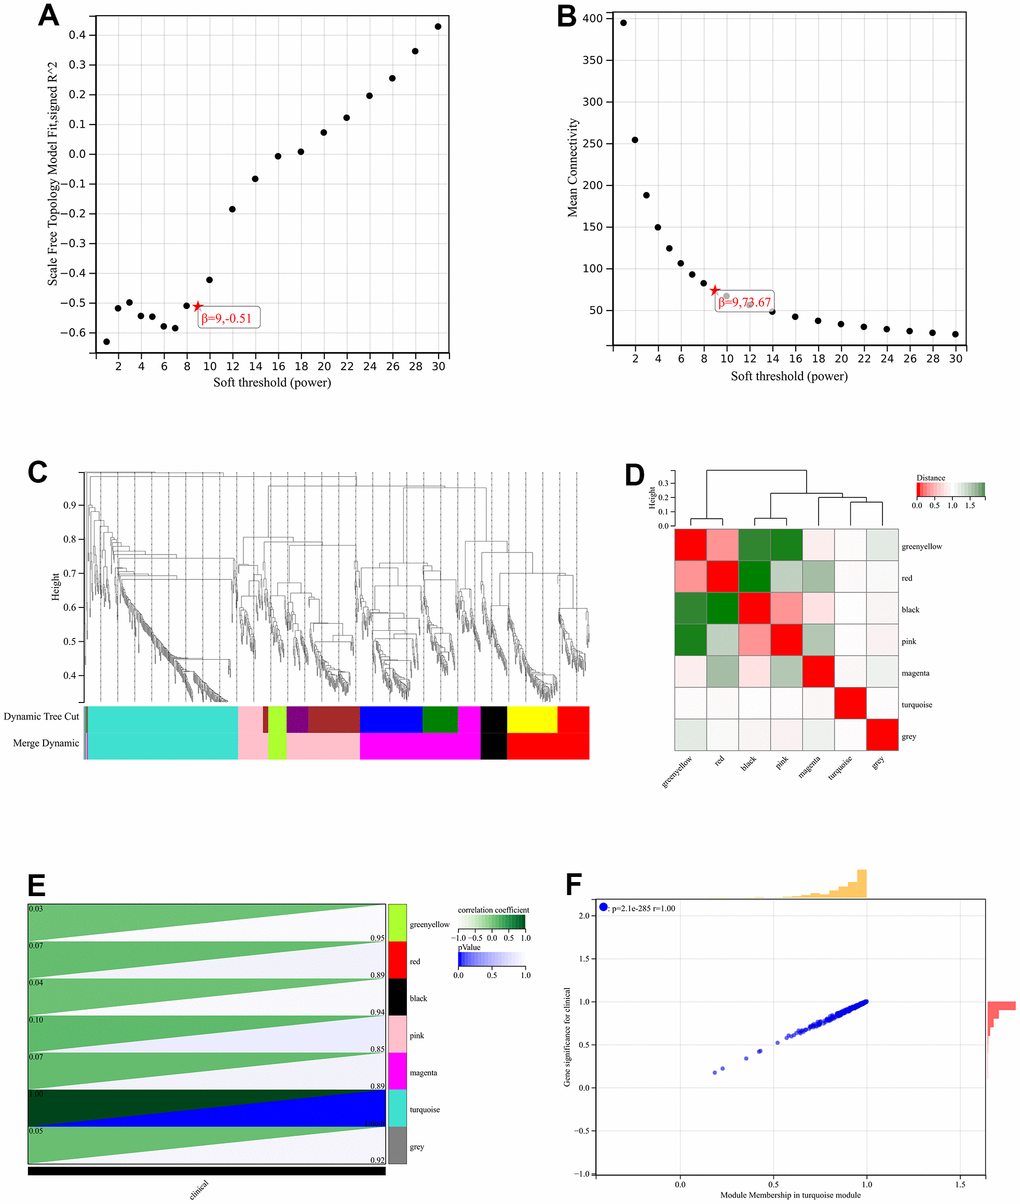
Figure 5.WGCNA. (A) β=6, 0.70 (B) β=6, 163.48 (C) A hierarchical clustering tree of all genes was constructed, and 3 significant modules were generated (D) Interactions between these modules were then analyzed (E) Generated a module to phenotype correlation Heatmap (F) GS to MM correlation scatter plot of the associated hub genes.