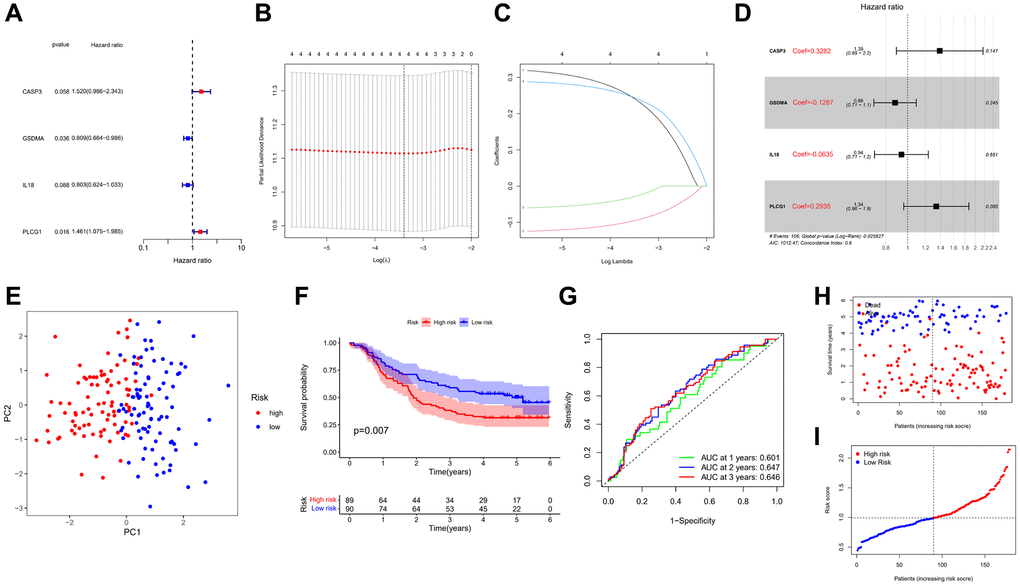
Figure 4.Development of prognostic model. (A) Forest plot of univariate Cox regression. (B, C) LASSO regression algorithm and cross-validation. (D) Forest plot of multivariate Cox regression. (E) PCA plot based on the risk score. (F) Kaplan-Meier curves for the OS of patients in the high- and low-risk groups. (G) ROC curves demonstrated the predictive efficiency of the risk score. (H) The survival status for each patient. (I) Distribution of patients based on the risk score.