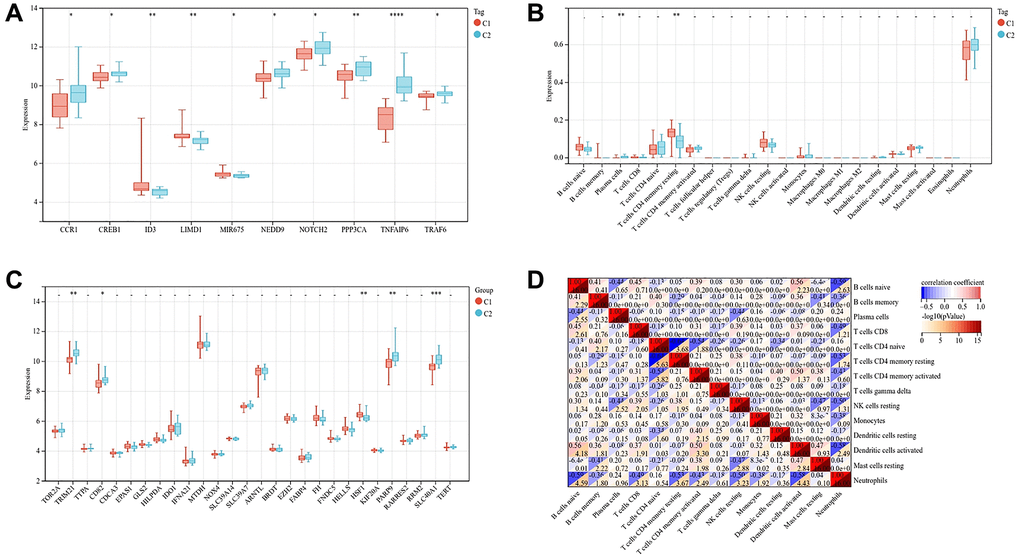
Figure 9.Gene expression and immune cell infiltration of two subtypes. (A) Expression of genes related to osteogenesis inhibition and osteoclast promotion in two subtypes. (B) Expression of genes related to ferroptosis in two subtypes. (C) Violin diagram shows the difference of immune cells between two subtypes of osteoporosis. (D) Correlation heatmap shows the relationship between immune cells. (The statistically significant difference was *p < 0.05, **p < 0.01, ***p < 0.001).