Submit an Article
Navigate
Home
Editorial Board
Editorial Policies
Current Volume
Archive
Scientific Integrity
Publication Ethics Statements
Interviews with Outstanding Authors
Newsroom
Sponsored Conferences
Podcast
Contact
Special Collections
Submit an Article
Online ISSN: 1945-4589
Research Paper
|
Volume 15, Issue 15
|
pp. 7781–7793
The prognosis of gliomas with different molecular subtypes in the era of intensity-modulated radiation therapy (IMRT)
Back to article
Figure 7
(7 of 7)
−
100%
+
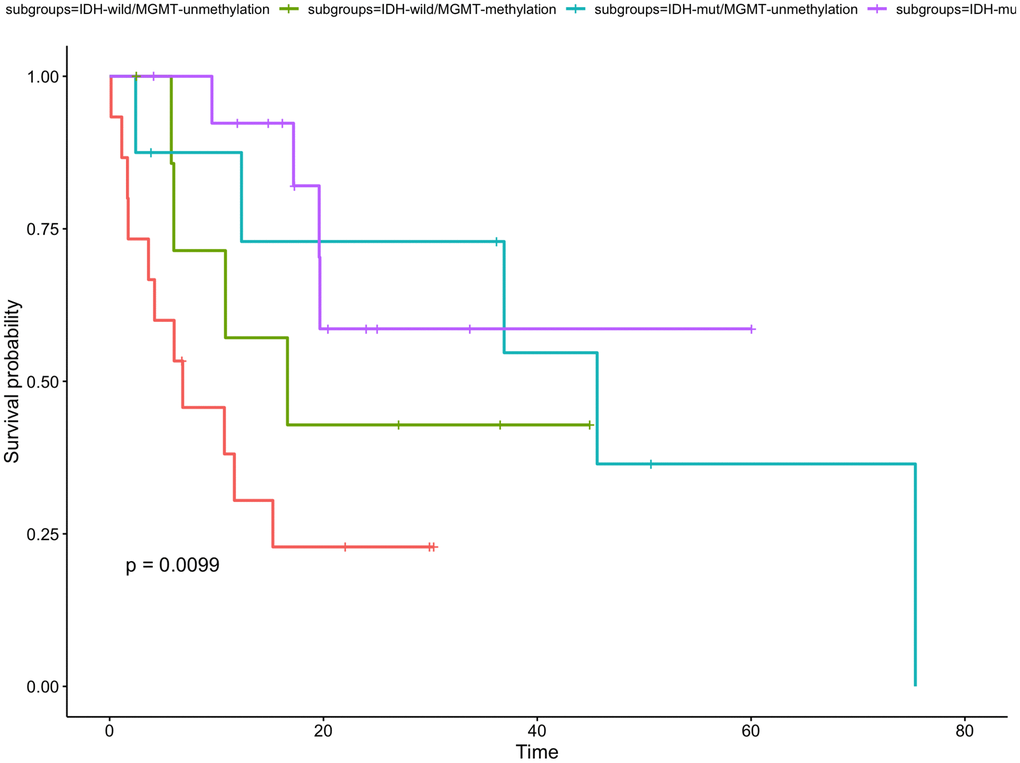
Figure 7.
Kaplan-Meier curve for time to tumor progression for gliomas with different IDH status and MGMT status.
The PFS of patients with IDH-mut/MGMT-methylation was the longest in the four subgroups.