Submit an Article
Navigate
Home
Editorial Board
Editorial Policies
Current Volume
Archive
Scientific Integrity
Publication Ethics Statements
Interviews with Outstanding Authors
Newsroom
Sponsored Conferences
Podcast
Contact
Special Collections
Submit an Article
Online ISSN: 1945-4589
Research Paper
|
Volume 15, Issue 15
|
pp. 7741–7759
The expression and prognostic value of disulfidptosis progress in lung adenocarcinoma
Back to article
Figure 3
(3 of 10)
−
100%
+
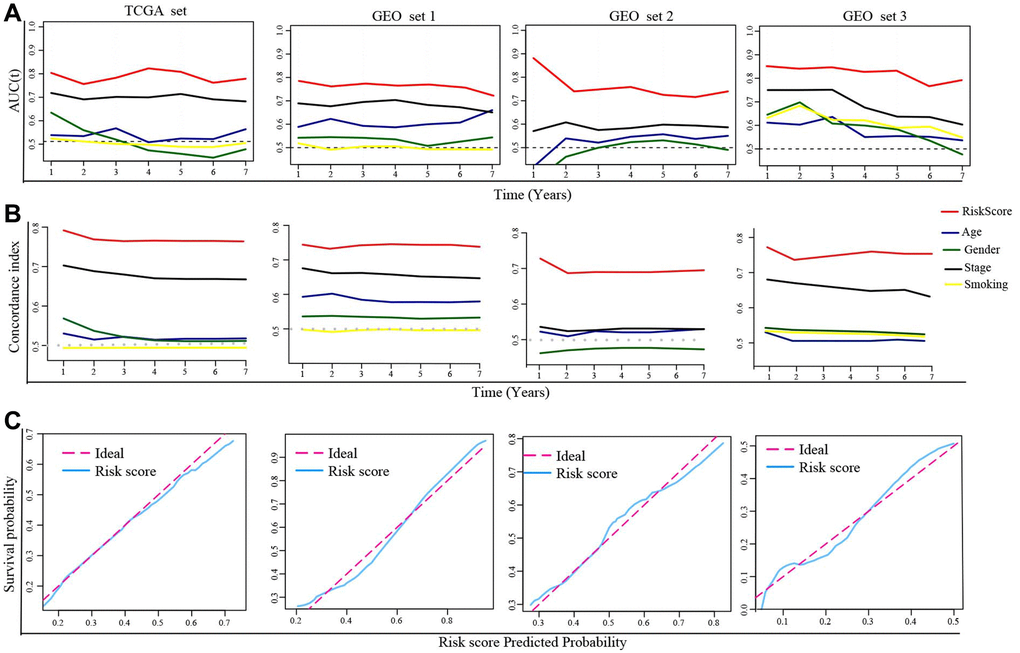
Figure 3.
Evaluation of the DRGs model.
(
A
) The time-dependent AUC value in each set. (
B
) The time-dependent C-index in each set. (
C
) The calibration plots of each set. Abbreviations: AUC: The area under the curve; C-index: concordance index.