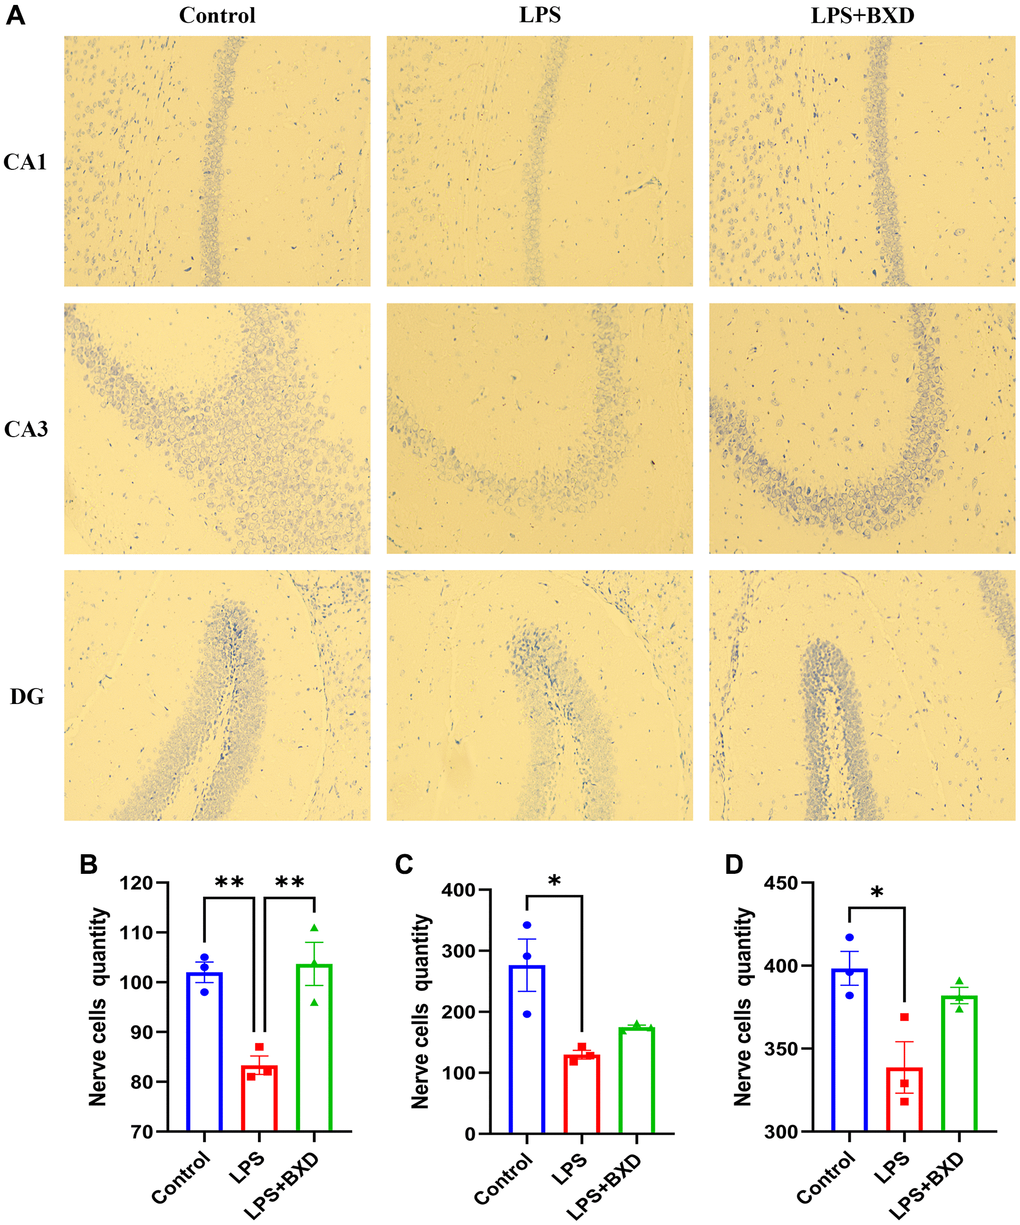
Figure 8.Nissl staining. (A–D) Changes and statistics of Nissl body in the hippocampal CA1, CA3 and DG regions of mice in each group after drug administration. Data represent the mean ± SEM (n = 3). **P < 0.01, *P < 0.05, compared with the LPS group.