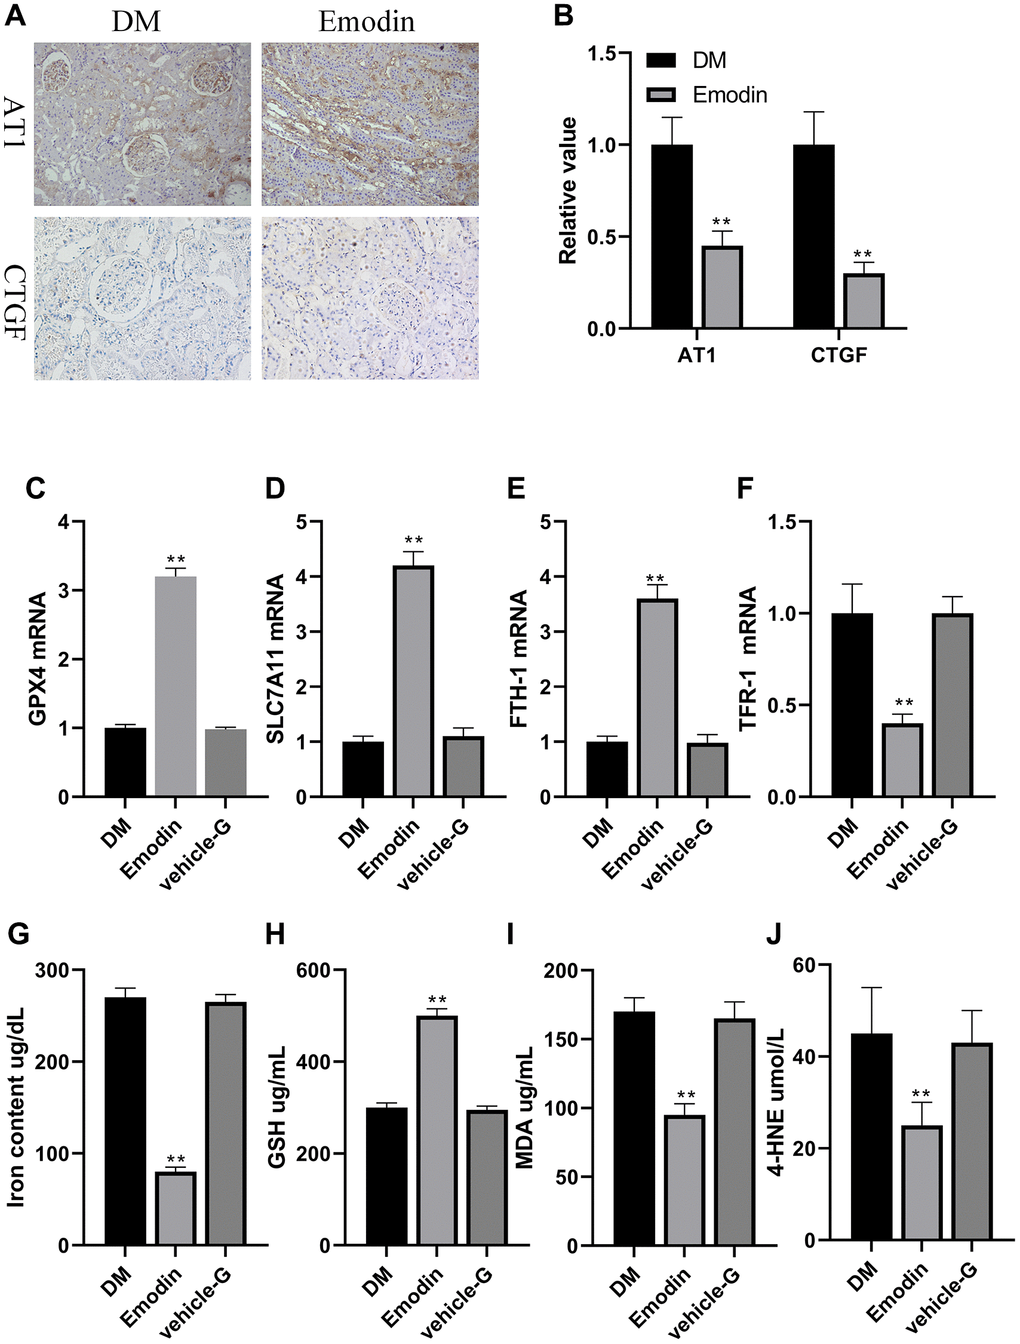
Figure 7.Emodin attenuated ferroptosis related marker in rats with DN. Immunohistochemical staining (A, 200× magnification) as well as semi-quantification (B) of AT1 and CTGF. The mRNA expression of ferroptosis related indicators in Emodin treated group (C–F). The concentration of iron content, GSH, MDA and 4-HNE (G–J). *P < 0.05, **P < 0.01 vs. model group.