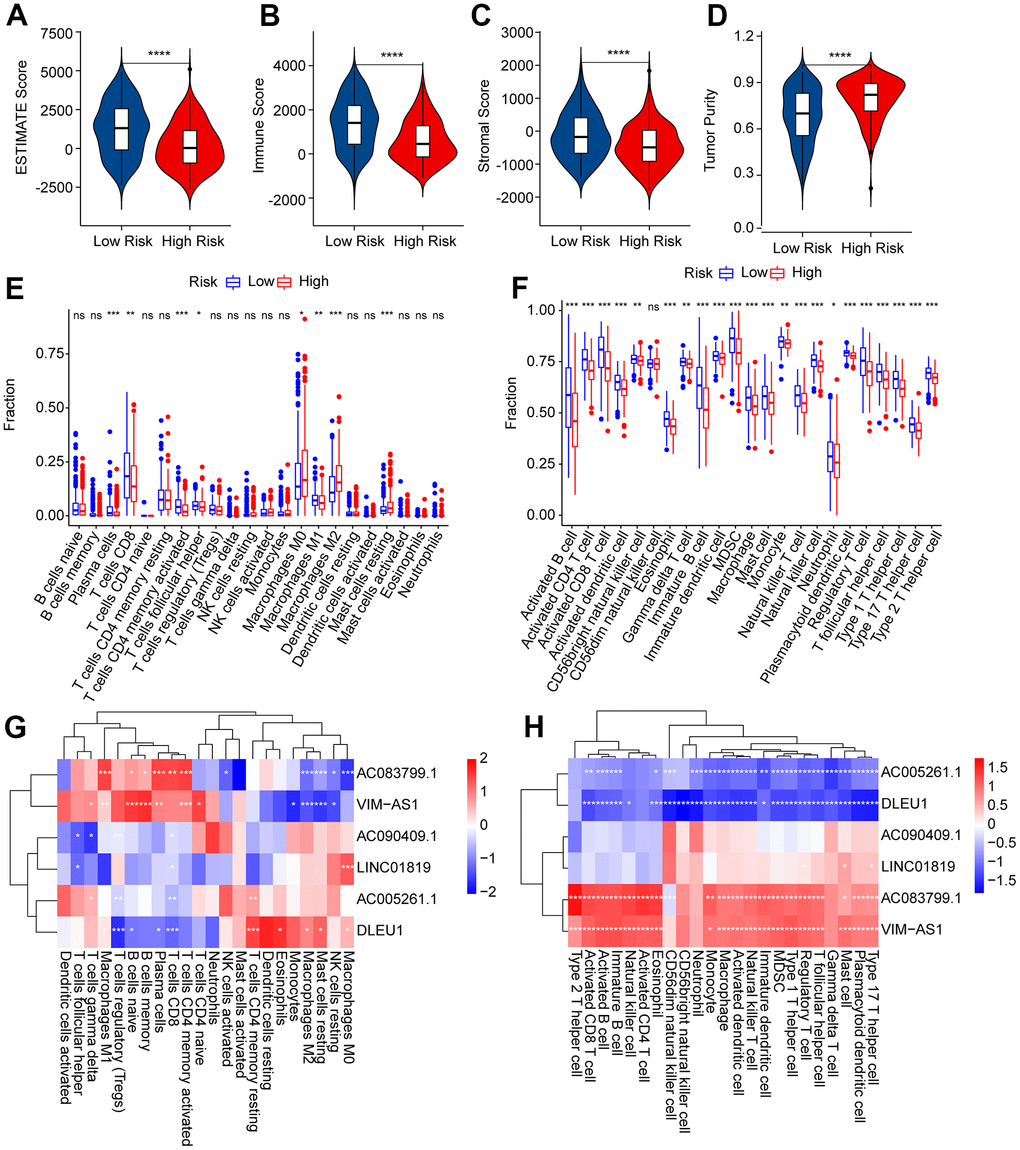
Figure 8.Immune infiltration landscape of patients with CM in the low- and high-risk group. (A–D) ESTIMATE, immune, stromal score, and tumor purity of patients with CM in the low- and high-risk group. (E) The fraction of 22-type immune cells of patients in the low- and high-risk group via the CIBERSORT algorithm. (F) The fraction of 23-type immune cells of patients in the low- and high-risk groups was analyzed by the ssGSEA algorithm. (G) Correlation investigation shows the relationship between the prognostic ARLs and 22-type immune cells. (H) Correlation investigation shows the relationship between the prognostic ARLs and 23-type immune cells.