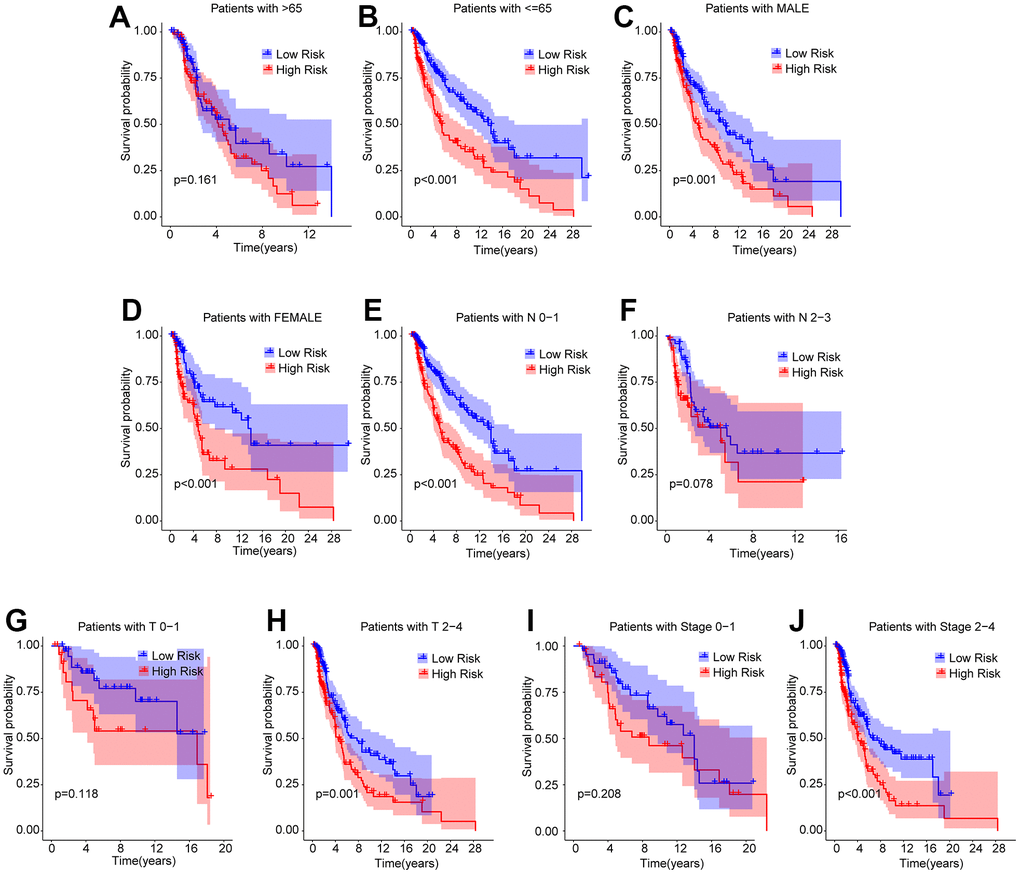
Figure 5.Subgroup analysis of CM patients with low- and high-risk scores in different clinicopathological characteristics. The Kaplan-Meier survival curve shows the OS rate of CM patients in the low- and high-risk group stratified by (A, B) Age (> 65 vs ≤ 65); (C, D) Gender (male vs female); (E, F) N (N 0–1 vs N 2–3); (G, H) T (T 0–1 vs T 2–4); (I, J) Stage (stage 0–1 vs stage 2–4).