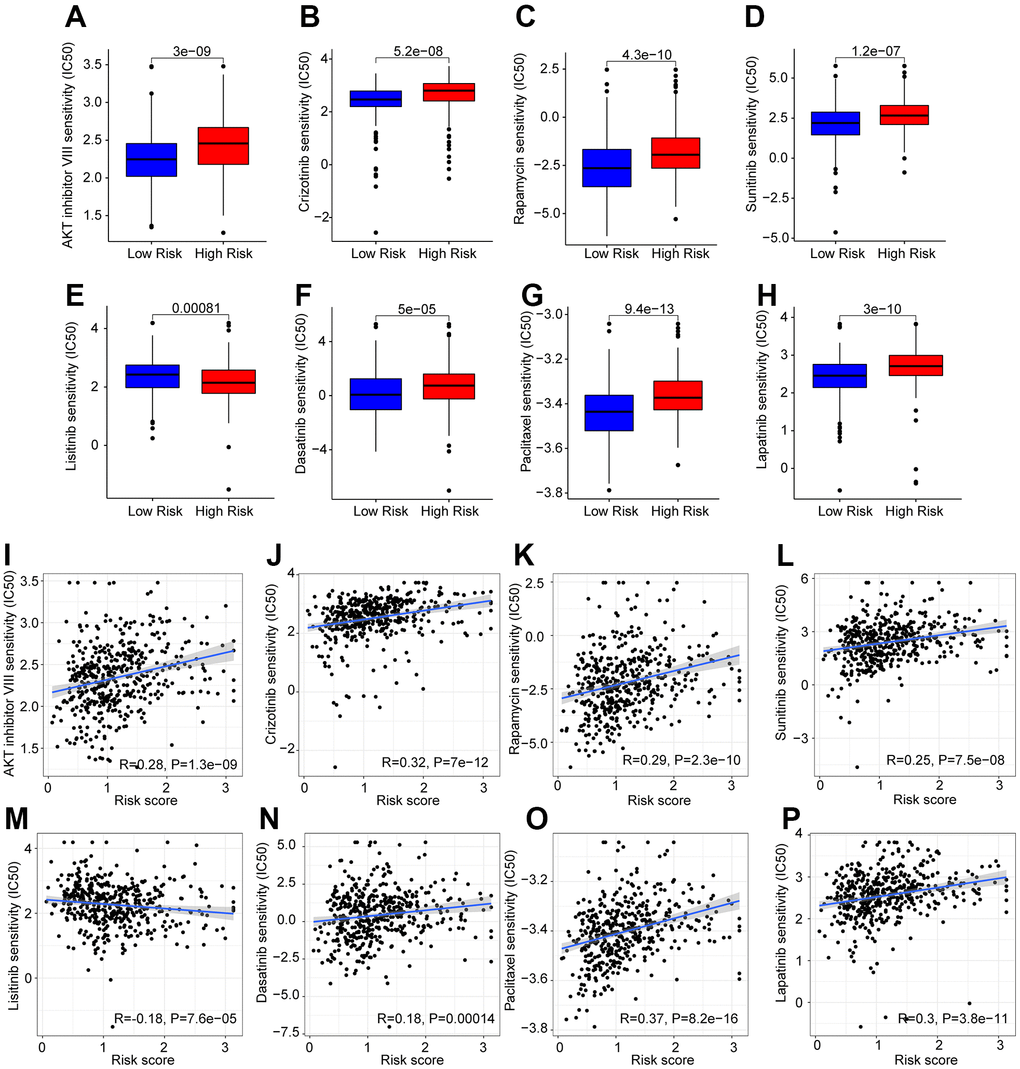
Figure 10.Drug sensitivity analysis in the low- and high-risk group. The IC50 classification reveals a remarkable distinction between patients in the low- and high-risk groups among (A) AKT inhibitor VIII; (B) Crizotinib; (C) Rapamycin; (D) Sunitinib; (E) Linsitinib; (F) Dasatinib; (G) Paclitaxel; (H) Lapatinib. (I–P) Correlation analysis of the drug sensitivity and risk score.