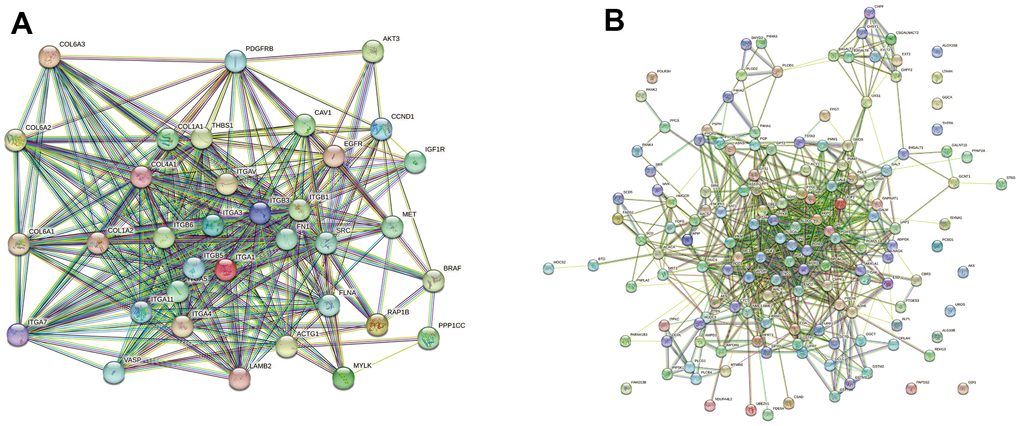
Figure 8.Network diagram of differentially expressed (DE) protein association. (A) In the FBLN2 knockdown cells, we performed PPI analysis on 35 scarcely expressed proteins associated with the focal adhesion pathway; (B) In the NPR3 knockdown cells, we performed PPI analysis on 146 scarcely expressed proteins related to the metabolic pathway.