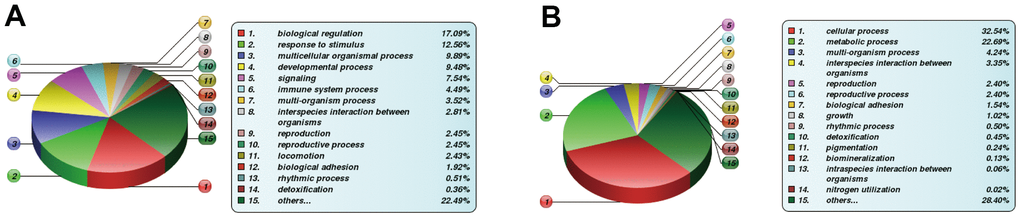
Figure 6.Differentially expressed (DE) protein stratification using GO secondary analysis. (A) Statistical Profile of DE proteins in GO secondary stratification (Biological Process) between FBLN2 deficient and control cells; (B) Statistical profile of DE proteins in GO secondary stratification (Biological Process, BP) between NPR3 deficient and control cells.