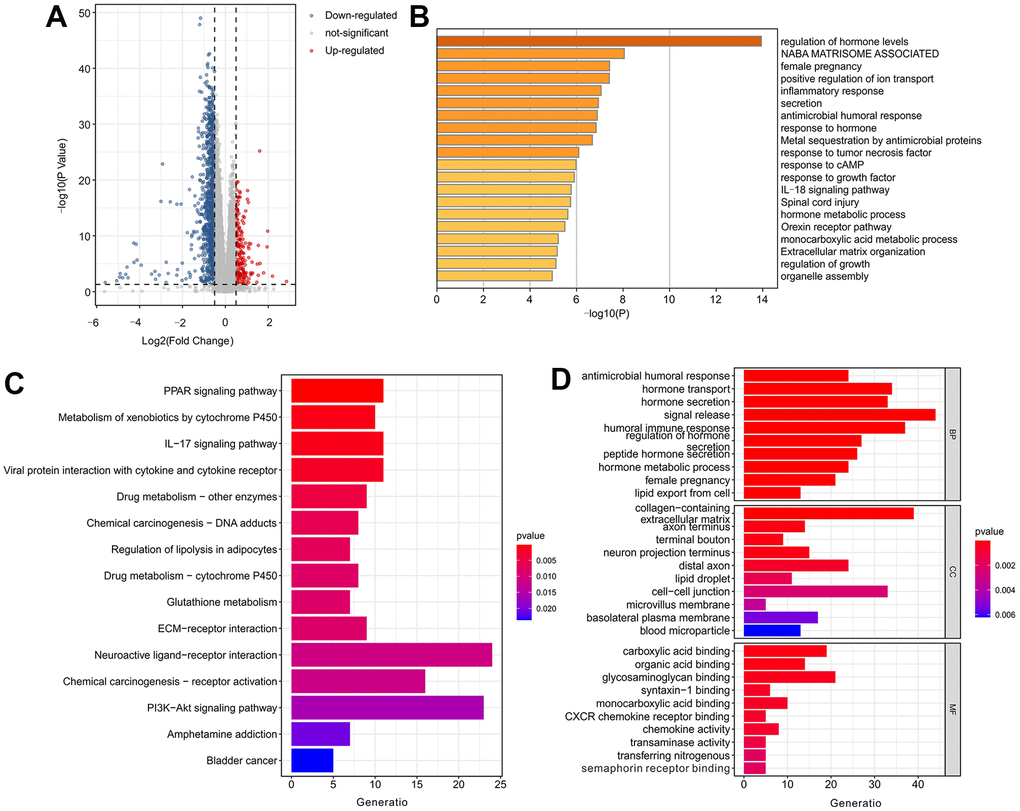
Figure 9.Functional enrichment analysis of differentially expressed genes (DEGs) in low-risk group and high-risk group. (A) Volcano diagram shows the DEGs in low-risk group and high-risk group with the threshold setting at |log2FC| ≥ 0.5 and P-value < 0.05. (B) Enrichment analysis of DEGs. (C) The top 15 KEGG enrichment analysis and (D) top 10 GO enrichment analysis of DEGs.