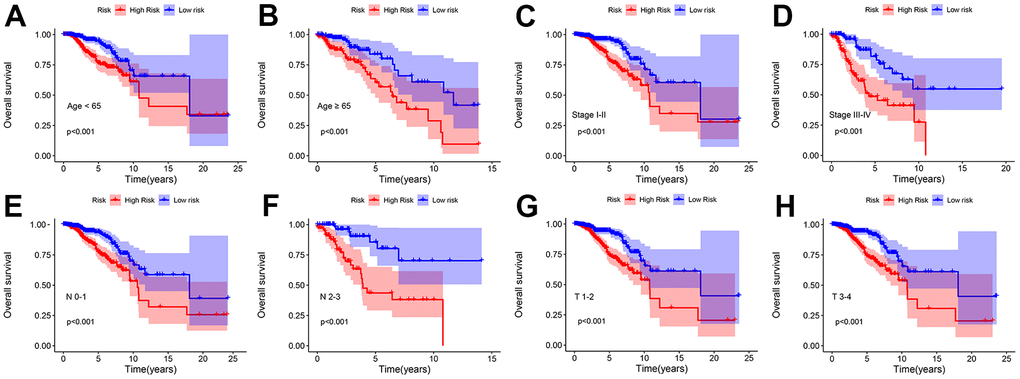
Figure 5.Kaplan–Meier survival curve of patients with breast cancer stratified by different clinicopathological characteristics. Kaplan–Meier survival curve analysis shows the OS rates of low- and high-risk patients with breast cancer stratified by (A, B) age < 65 vs. ≥ 65, (C, D) Stage I–II vs. Stage III–IV, (E, F) N 0–1 vs. N 2–3, (G, H) T I–II vs. T III–IV.