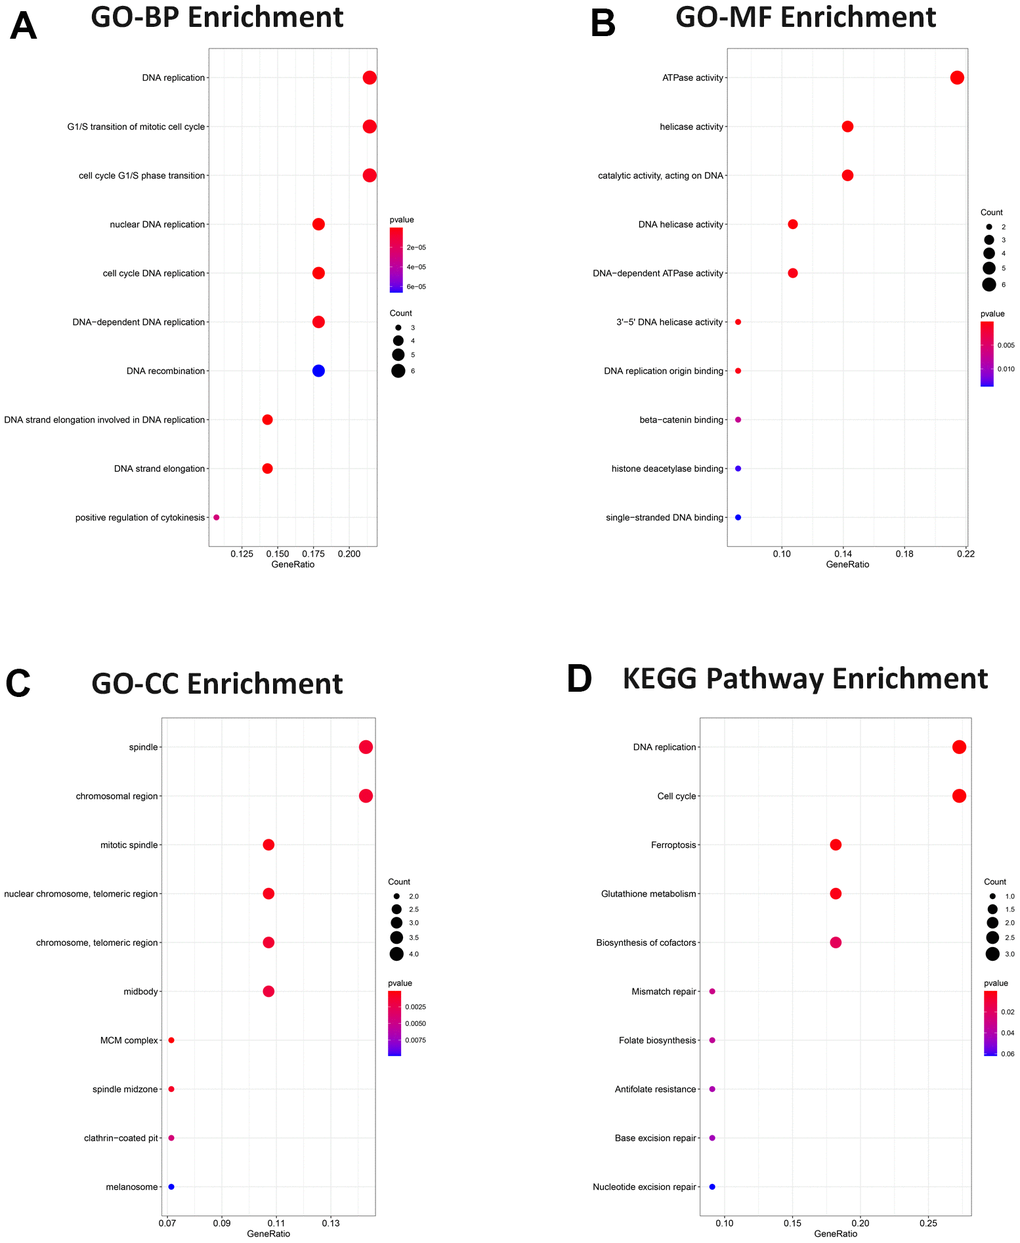
Figure 6.Gene ontology and pathway functional enrichment analysis. (A) BP analysis. (B) MF analysis. (C) CC analysis. (D) KEGG pathway. Functional and pathway enrichment were presented in bubble charts, ranking the top 10 according to adjusted P value.