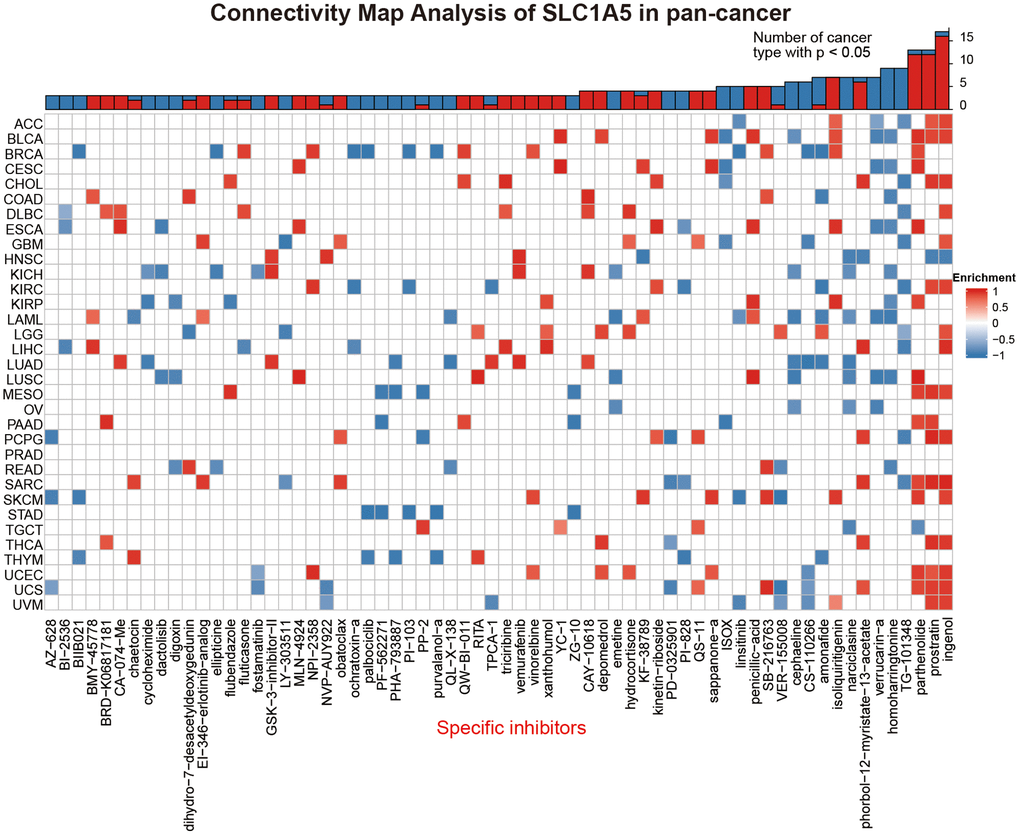
Figure 7.The heatmap represents the enrichment score (positive in blue, negative in red) for each drug in each cancer in the CMap database. Components or drugs are sorted from right to left with a decreasing number of enriched cancers.
Figure 7 — SLC1A5 is a novel biomarker associated with ferroptosis and the tumor microenvironment: a pancancer analysis | Aging