Submit an Article
Navigate
Home
Editorial Board
Editorial Policies
Current Volume
Archive
Scientific Integrity
Publication Ethics Statements
Interviews with Outstanding Authors
Newsroom
Sponsored Conferences
Podcast
Contact
Special Collections
Submit an Article
Online ISSN: 1945-4589
Research Paper
|
Volume 15, Issue 15
|
pp. 7451–7475
SLC1A5 is a novel biomarker associated with ferroptosis and the tumor microenvironment: a pancancer analysis
Back to article
Figure 4
(4 of 9)
−
100%
+
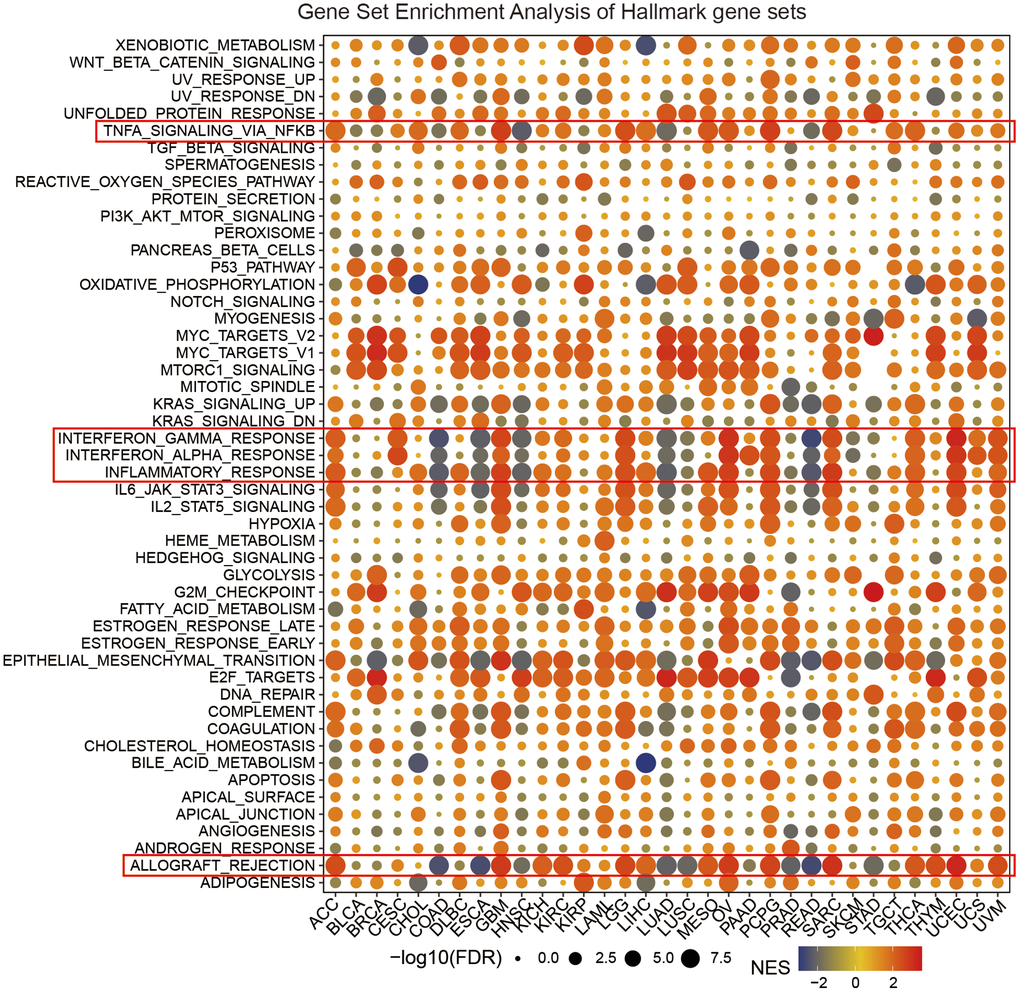
Figure 4.
Gene set enrichment analysis (GSEA) of the SLC1A5 gene set across cancers.
The size of the circle indicates the FDR value of the enriched element in each cancer, and the color indicates the normalized enrichment score (NES).