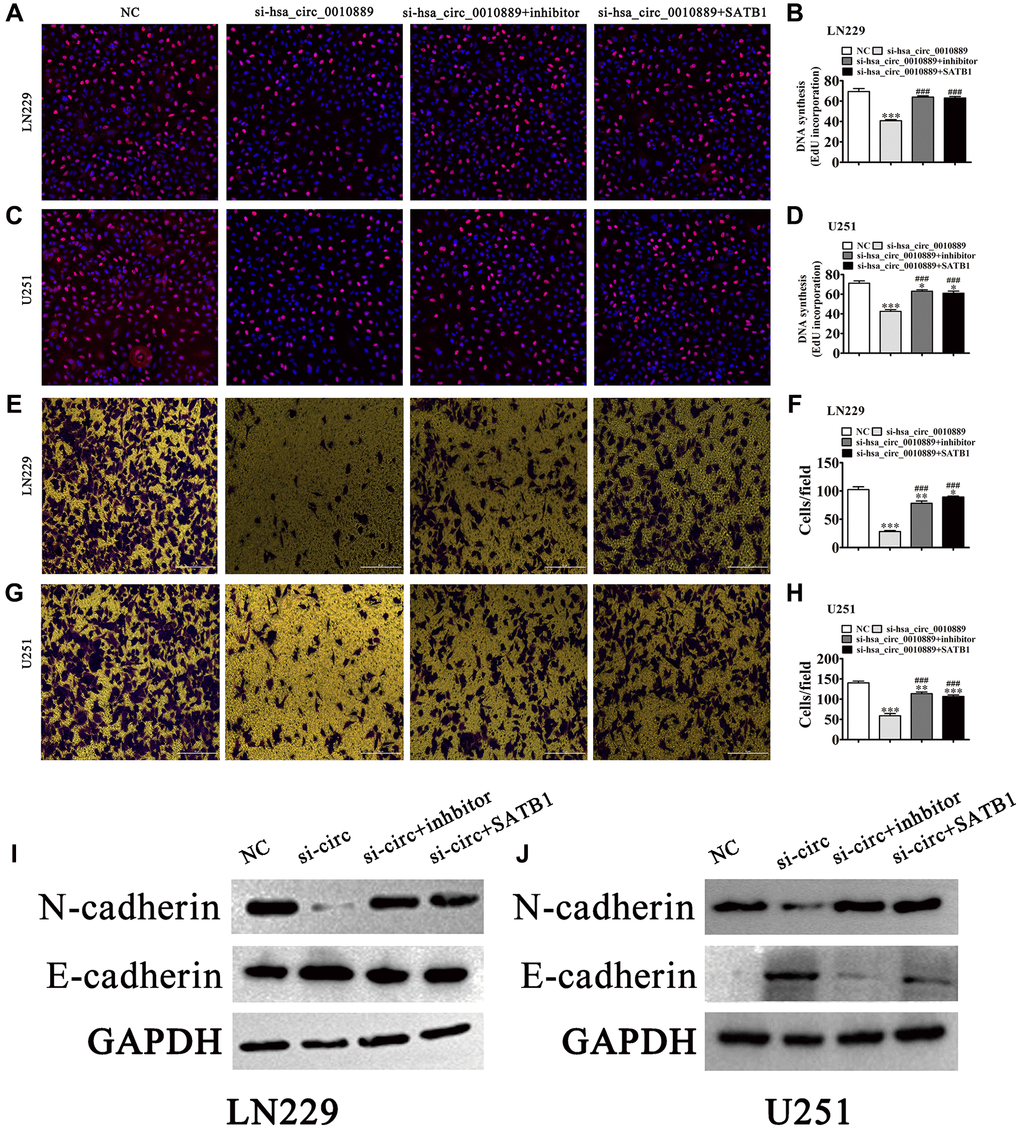
Figure 5.Overexpression of SATB1 or inhibition of miR-590-5p reversed glioma cell proliferation and migration after silencing hsa_circ_0010889. (A–D) EdU detection showing the proliferative ability of LN229 and U251 cells. The data are expressed as the mean ± SD. *P < 0.05, ***P < 0.001 vs. NC. ###P < 0.001 vs. si-hsa_circ_0010889. (E–H) Transwell detection showing migration of LN229 and U251 cells. The data are expressed as the mean ± SD. *P < 0.05, **P < 0.01, ***P < 0.001 vs. NC. ###P < 0.001 vs. si-hsa_circ_0010889. (I, J) Western blot results showing the expression of E-cadherin and N-cadherin.