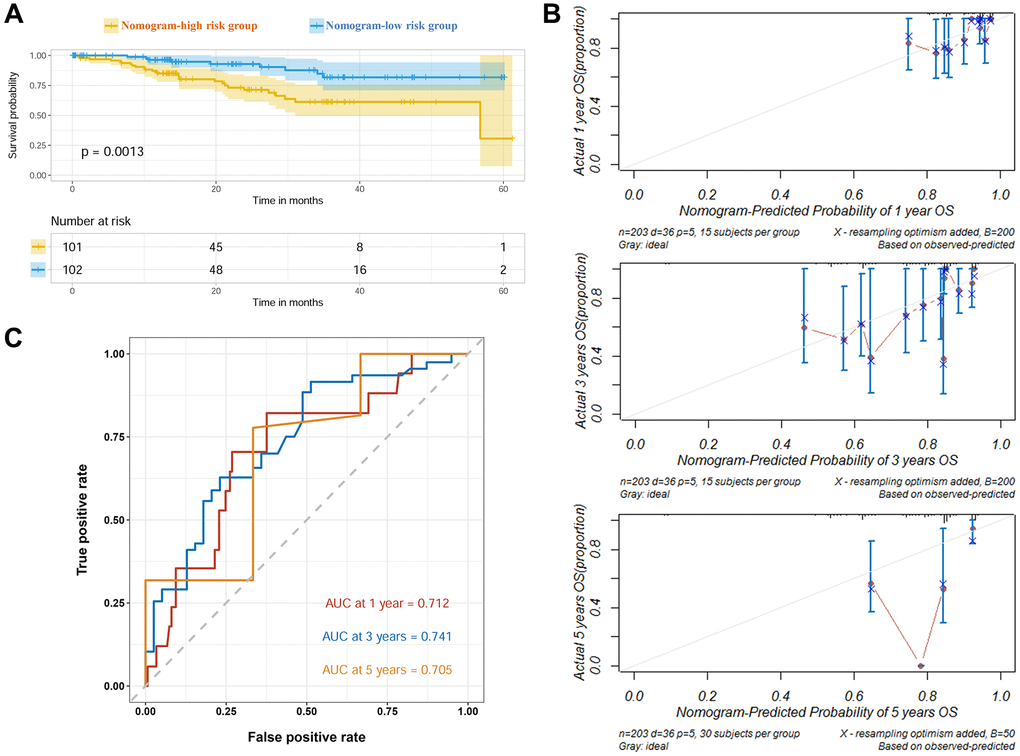
Figure 4.Verification of the prognostic nomogram in CPTAC cohort. (A) Survival curves of high and low nomogram risk groups plotted by K-M method. (B) Calibration curves of the nomogram at 1, 3 and 5 years. (C) ROC curves of the nomogram at 1, 3 and 5 years.