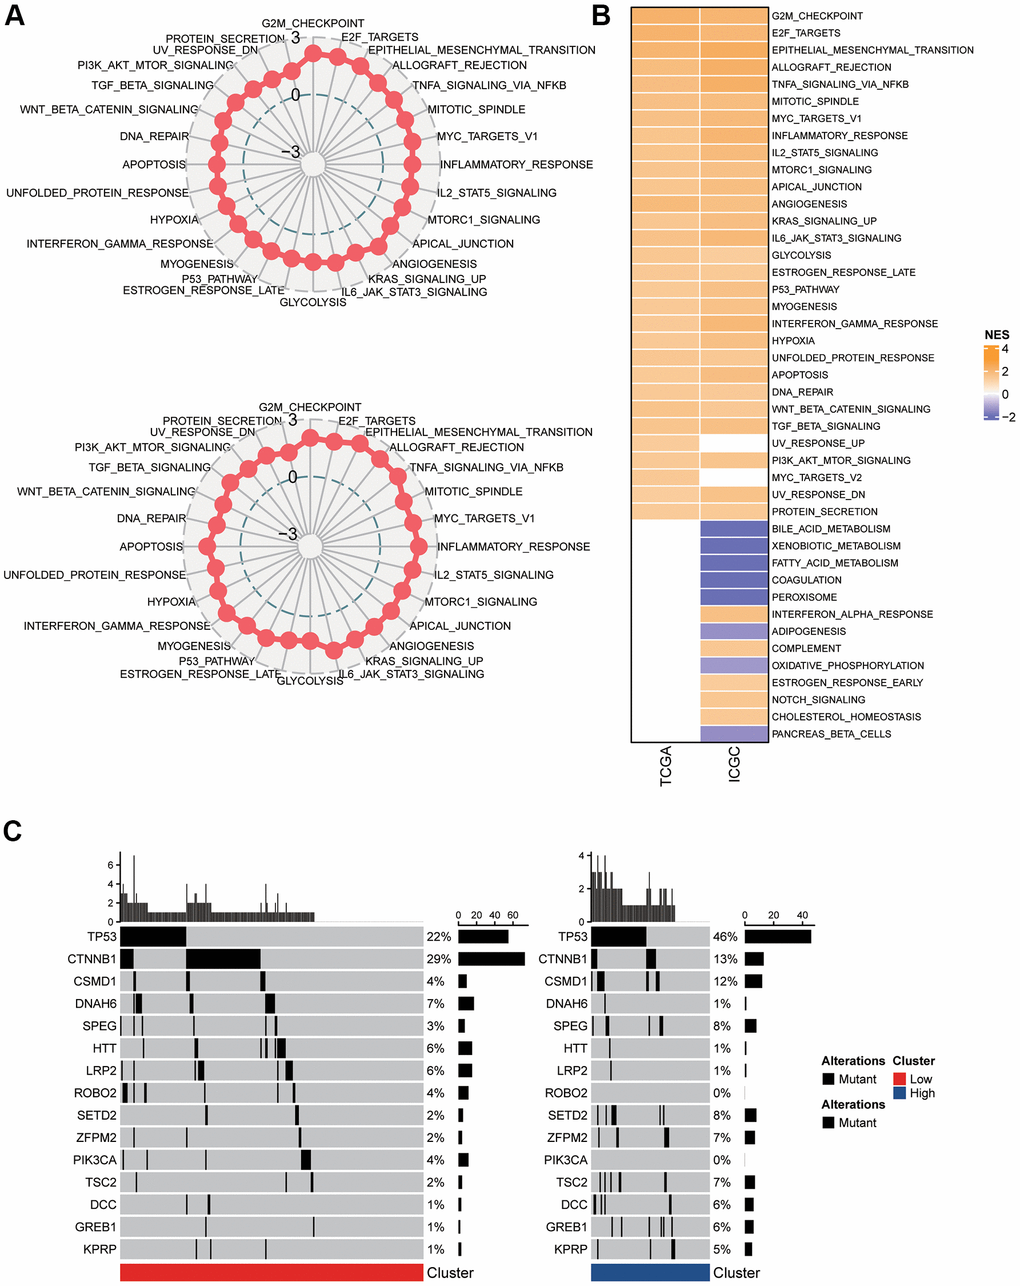
Figure 3.Pathway analysis of the mTORC1 signaling-related signature. (A) Radar plots demonstrating the NESs of the Hallmark pathways computed utilizing GSEA of C2 versus C1 in TCGA-LIHC and ICGC-LIRI-JP cohort. (B) A heatmap representing NESs of the Hallmark pathways computed through comparison of C2 with C1 in TCGA-LIHC and ICGC-LIRI-JP cohort. (C) Somatic mutation analysis of the two molecular subtypes.