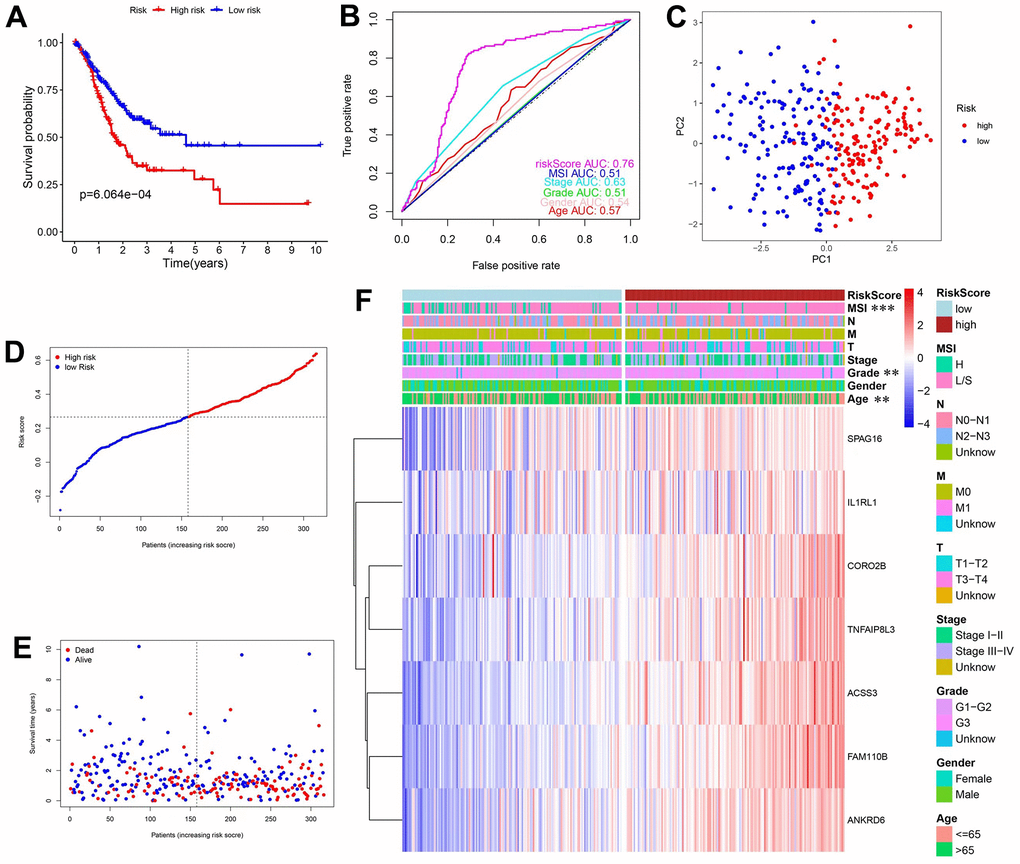
Figure 3.Construction and validation of prediction model in the TCGA database. (A) KM curves and survival analysis. (B) Time-dependent ROC curves and AUCs. (C) PCA analysis. (D) Distribution of risk scores and median values. (E) Scatter plot showing the overall survival of patients. (F) Heatmap of the 7 genes used in the model.