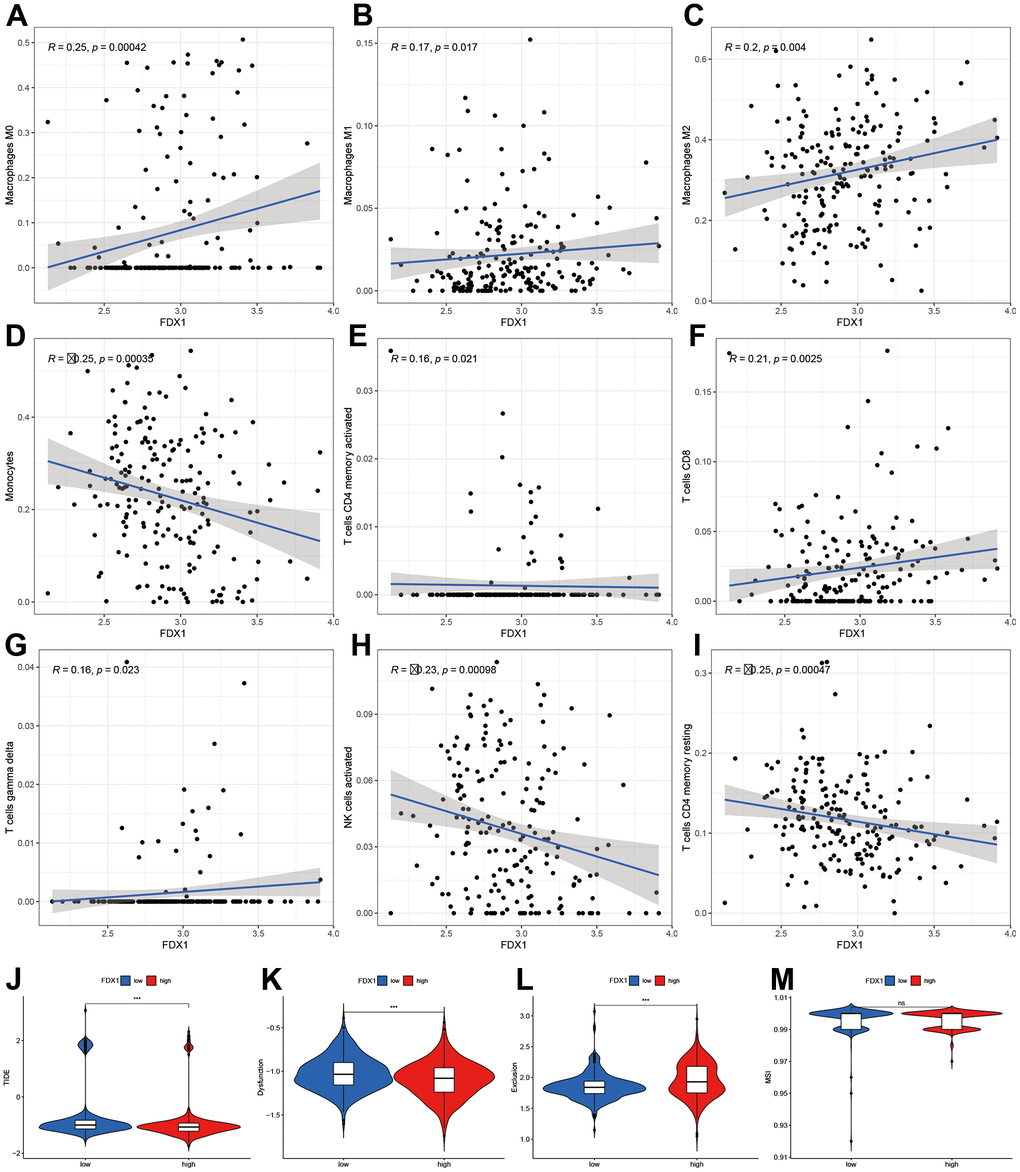
Figure 6.Correlation of FDX1 expression with immune cells and immunotherapy. (A–I) Scatter plot indicating the association between FDX1 and macrophages (M0, M1, and M2), monocytes, activated CD4 memory T cells, CD8 T cells, gamma delta T cells, activated NK cells, and resting CD4 memory T cells. (J–M) Correlation between FDX1 and immunotherapy response using TIDE, dysfunction, exclusion, and MSI.