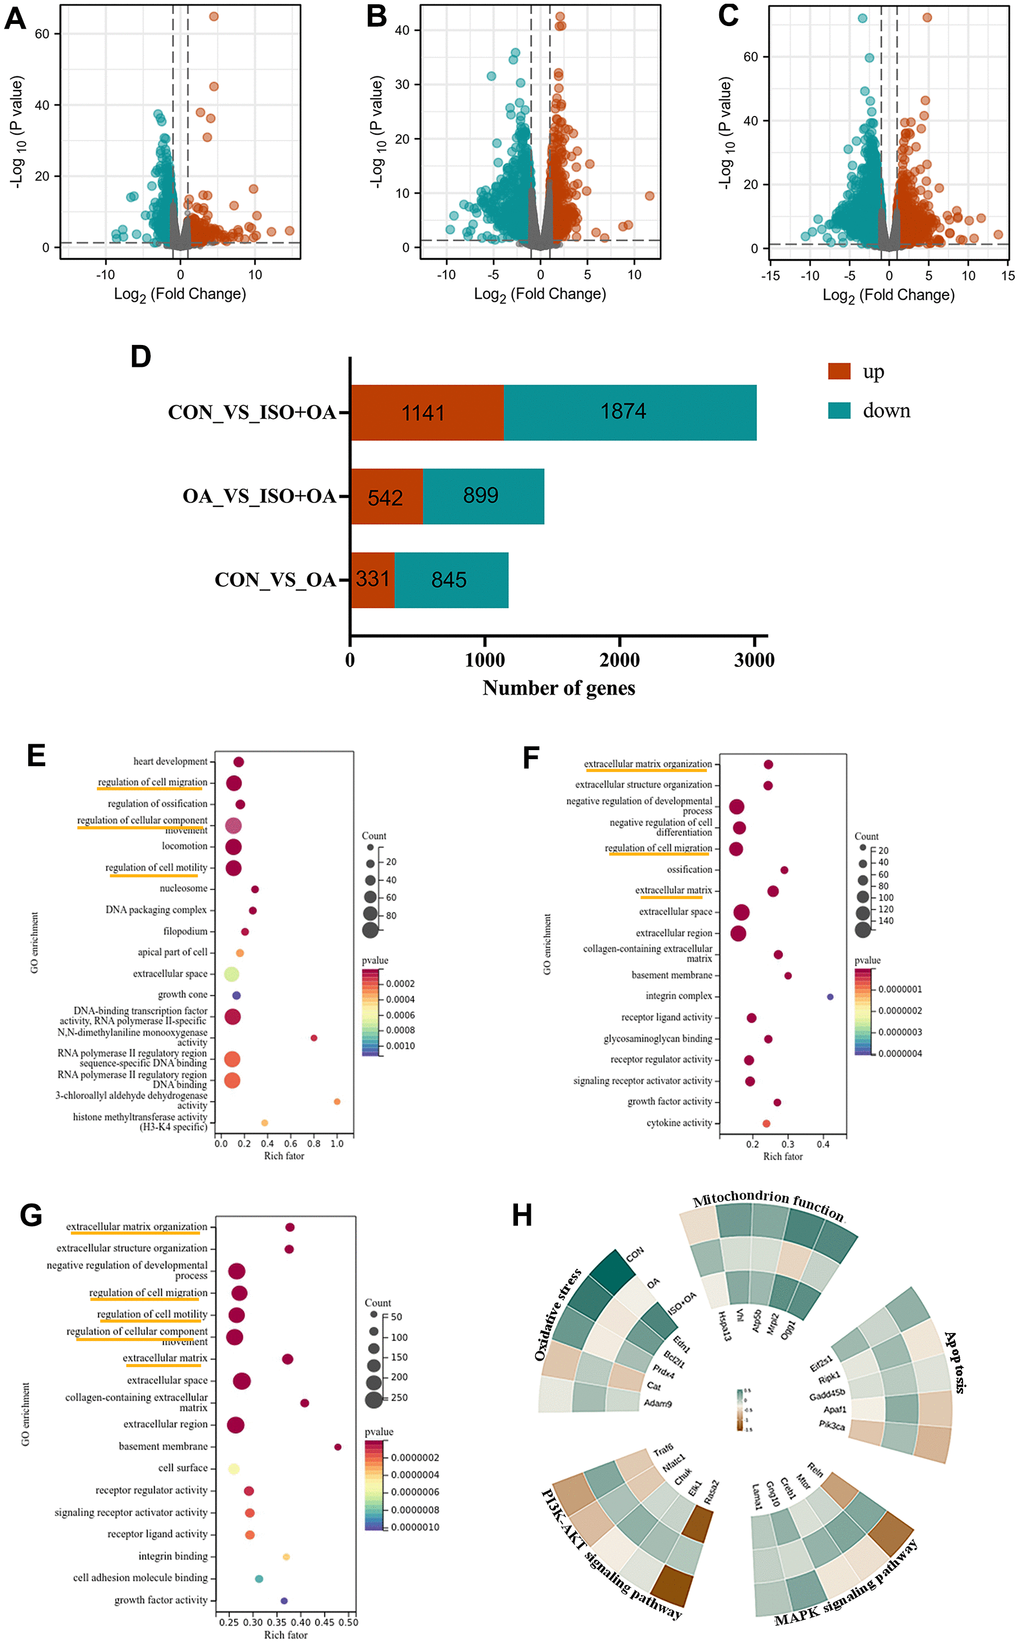
Figure 2.The result of RNA-seq analysis. (A–C) The volcano plot shows the distribution of genes and the results of significant differences in genes. (A) Control group vs OA group. (B) OA group vs ISO+OA. (C) Control group vs ISO+OA. (D) The up-regulation and down-regulation of gene in this study, Fold change > 1.5, p < 0.05. (D–F) The GO enrichment analysis. (E) Control group vs OA group. (F) OA group vs ISO+OA. (G) Control group vs ISO+OA. (H) Heat map of the representative function.